By moving beyond the limitations of standard 2D operational availability and performance ratio (PR) assessments, Enurgen’s software successfully bridges P50 underperformance gaps and allows for the precise isolation of complex losses —ranging from multi-tier POA irradiance bias and diffuse shading to specific hardware defects such as capacitor bank failures and tracker backtracking misalignments.
Enurgen’s proprietary three-step operational deployment includes addressing the budgeted-to-expected production gap, establishing a new performance baseline, and identifying performance issues in operational sites.
Step 1: Building the 3D FEM Model
The deployment process begins with constructing a 3D finite-element method (FEM) model using Enurgen’s DUET engine. As-built system models can be quickly generated directly within the platform or can be streamlined by consuming existing PVsyst project files.
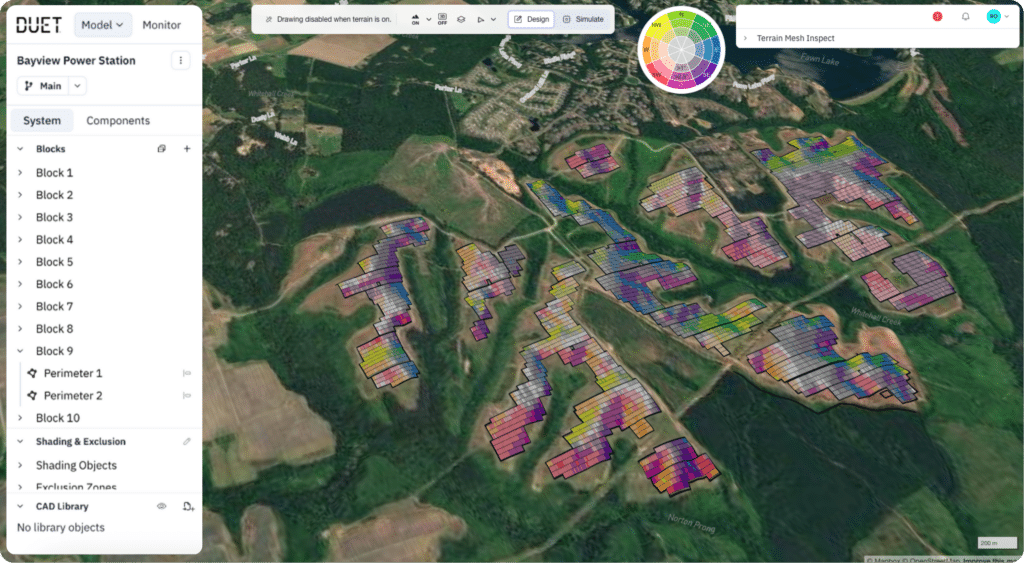
Client-provided wiring schematics, racking configurations, and other related information like the geographic locations of inverters, combiner boxes, and on-site meteorological stations are used to build the model of the existing plant.
Site layouts are built on a block-basis—each block having independent components and layouts. Specific components such as panels and inverters can be imported from .PAN files, .OND files, a PVsyst project, CEC database, or defined directly within the platform. Once imported, parameters within each component can be modified directly in-app for ease and flexibility. Terrain and near shading elements can also be included in the model to create a digital reproduction of the site.
Step 2: PV Performance Synchronization
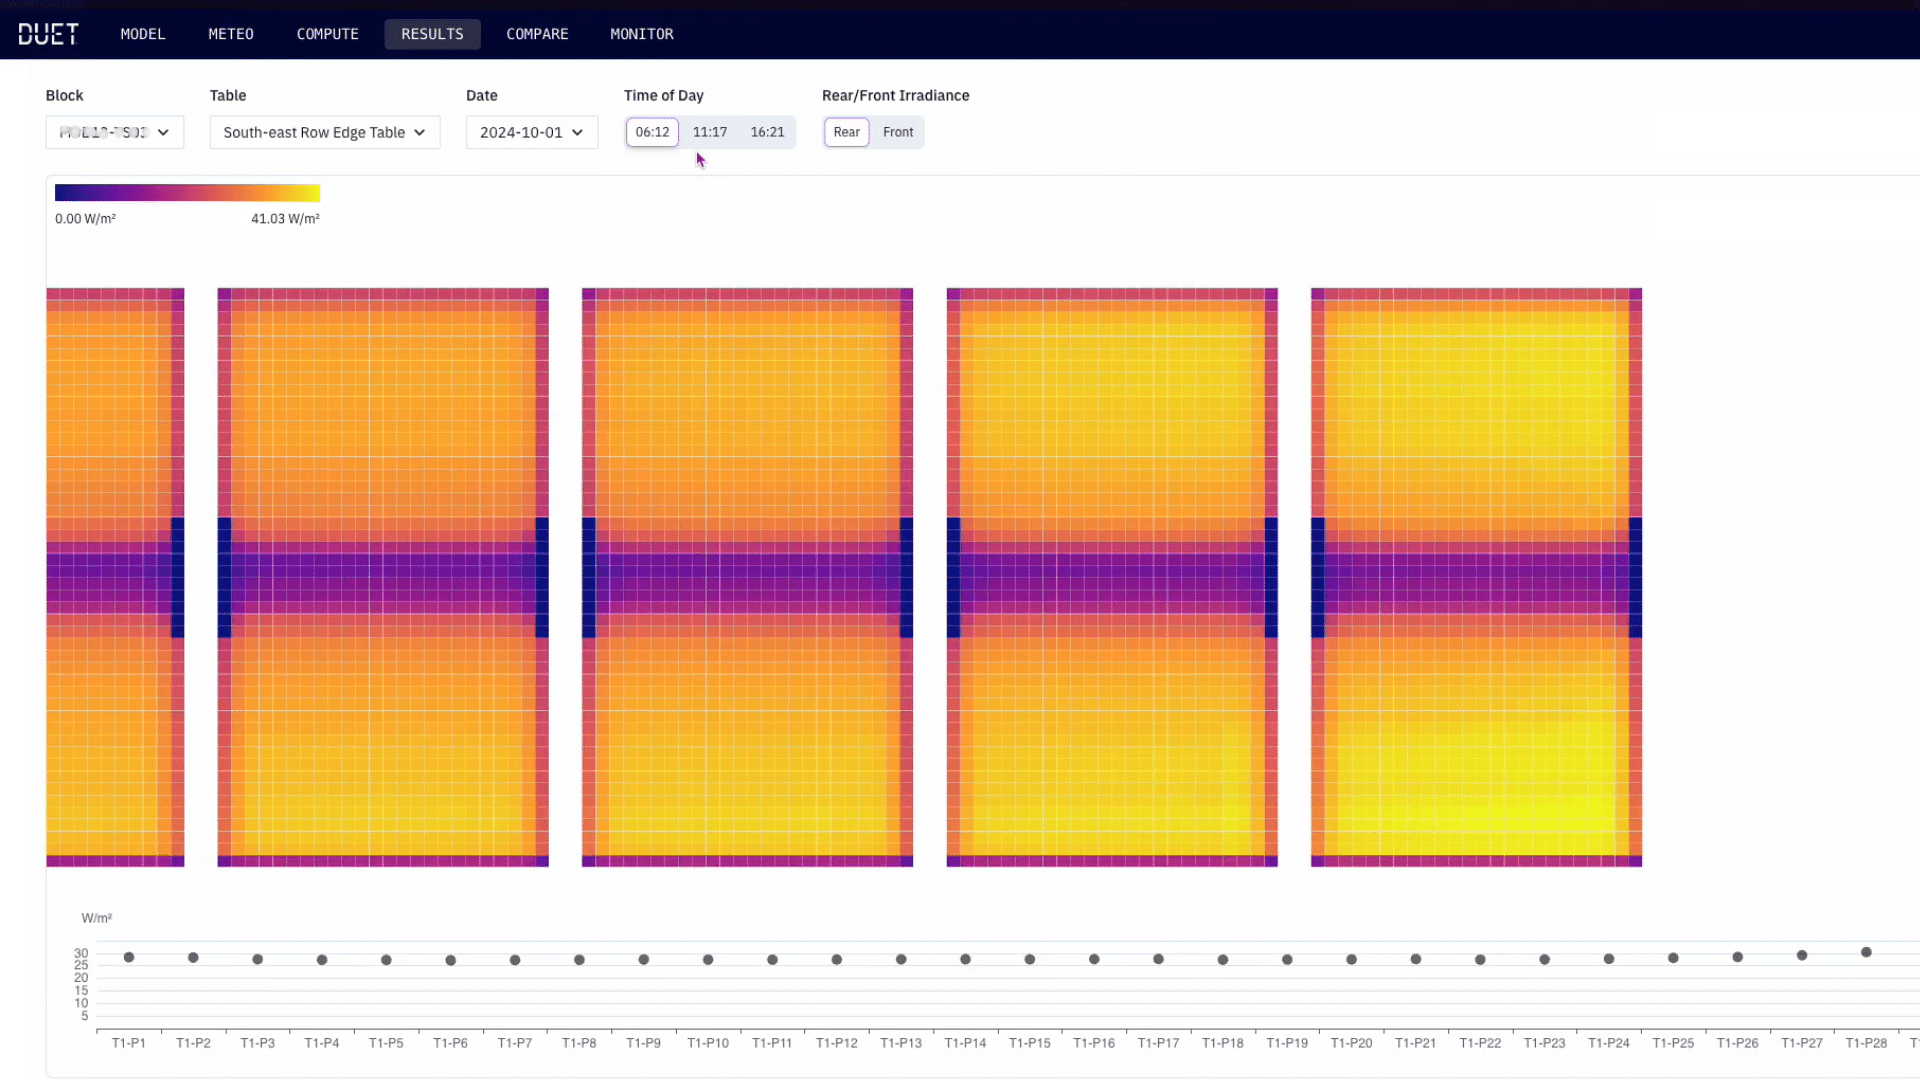
Once the new model is built, the budgeted-to-expected gap is addressed by comparing simulations using field meteorological data to the original client energy model. To strictly isolate model performance, both the budgeted model (e.g. PVsyst) and Enurgen simulations are executed using identical field meteorological data, soiling profiles, and degradation assumptions. These energy models are then leveraged in the PV performance synchronization stage, where historical field measurements and meteorological station data are ingested and compared against the expected model outputs.
The analysis at this stage reveals the model-to-field energy yield deviation for the legacy budgeted model compared to the new model. This comparison isolates the specific budgeted-to-expected modelling bias.
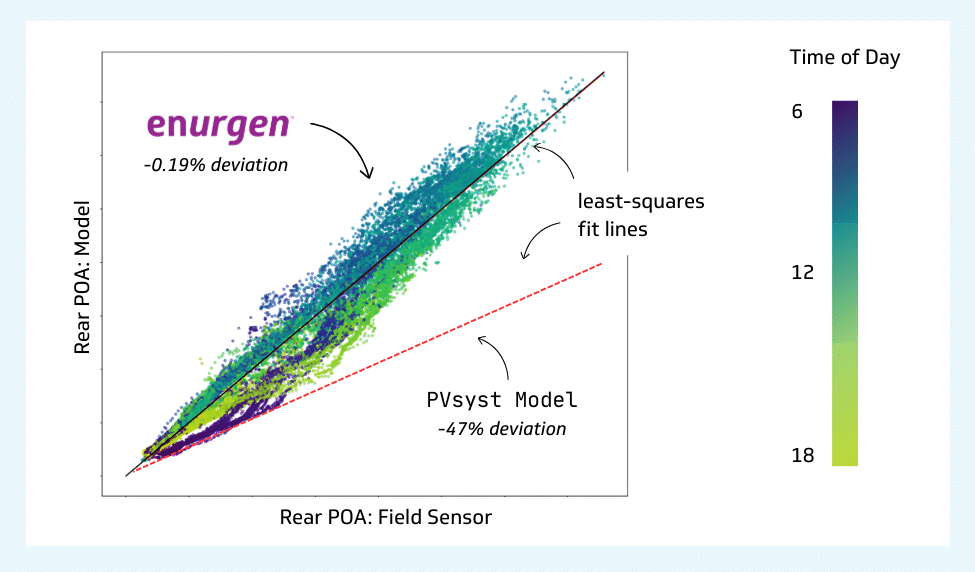
also PVsyst’s 2D VF model (dashed red line represents its least-squares fit)
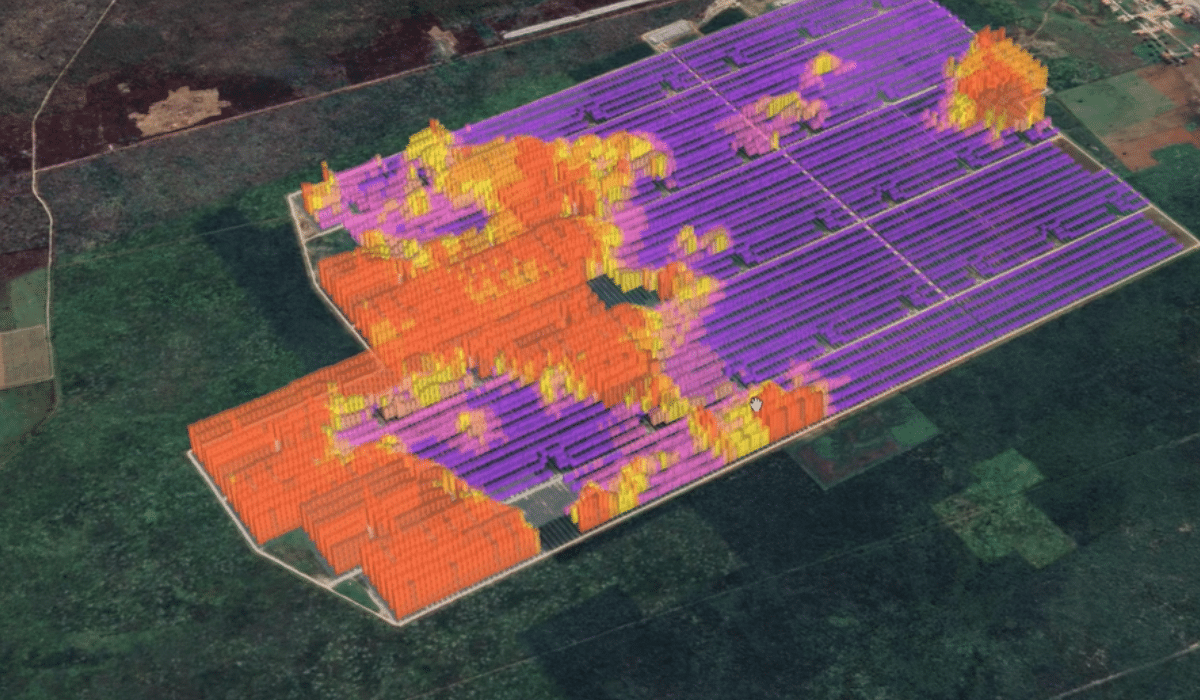
The discrepancies between PVsyst models and Enurgen’s models stem from fundamental differences in electrical and optical modelling. PVsyst is a 2D view factor model that calculates irradiance along a 1D line and assumes a constant value across an infinite shed. In contrast, Enurgen’s 3D FEM approach generates detailed 2D plane of array (POA) irradiance profiles with sub-cell resolution at every timestep.
This increased resolution is critical to capture cell-to-cell mismatch for the optical-to-electrical conversion and generation of current-voltage (IV) curves for each cell, panel, and string. The resulting energy yield difference is ultimately attributed to Enurgen’s ability to capture complex phenomena that 2D models miss, including diffuse row-to-row shading, complex terrain, edge brightening, mismatch losses, and near-shading effects.
Step 3: Operational Deployment and Loss Identification
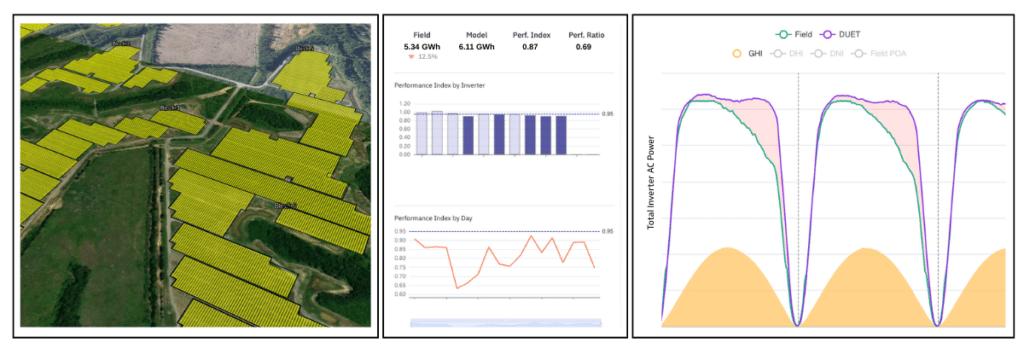
Enurgen’s model is deployed to run continuously in operations against SCADA data, automating daily PV performance workflows and feeding precise loss and expected production metrics directly into the customer’s target database.
By leveraging the high spatial and temporal precision of the new model to compute the expected energy yield, Enurgen can establish a new baseline reference to determine the power plant’s true real-time performance capability. The primary objective of this phase is to reconcile the remaining gap between the expected yield and the actual field-realized production.
To bridge this gap, the high-fidelity physics engine is used to identify performance issues and accurately quantify their impact. This process is integrated into the operator’s existing loss logs to filter out known events and operator-flagged losses such as known downtime and scheduled maintenance. By systematically removing these known losses from the deviation dataset, the remaining unexplained sources of underperformance can be isolated for targeted analysis and remediation.
This remaining performance gap is categorized as recoverable and unrecoverable losses and attributed with internal loss detection and categorization algorithms to issues like inverter or combiner outages/underperformance, tracker misalignment, spatiotemporal irradiance variability, degradation, soiling, snow accumulation, grid interconnection issues, curtailment, or other quantifiable losses.

Conclusion
The more granular approach of a 3D FEM model transforms unidentified and unexplained underperformance into actionable insights, identifying immediately recoverable annual revenue across solar assets. Bridging the gap between detailed design and operations with modelling performance baselines is a vital financial imperative to ensure predictability, repeatability, and scalability in growing solar portfolios.