Software to deliver breakthrough energy yields
Redefine performance and increase revenue with DUET's next-generation accuracy, analysis, and actionable results.
Request a demo






For a 100 MW plant, DUET delivers $8M in additional revenue over the asset lifetime. Across a 5 GW portfolio, that translates to $400M.
3D Physics-Based Performance Baseline
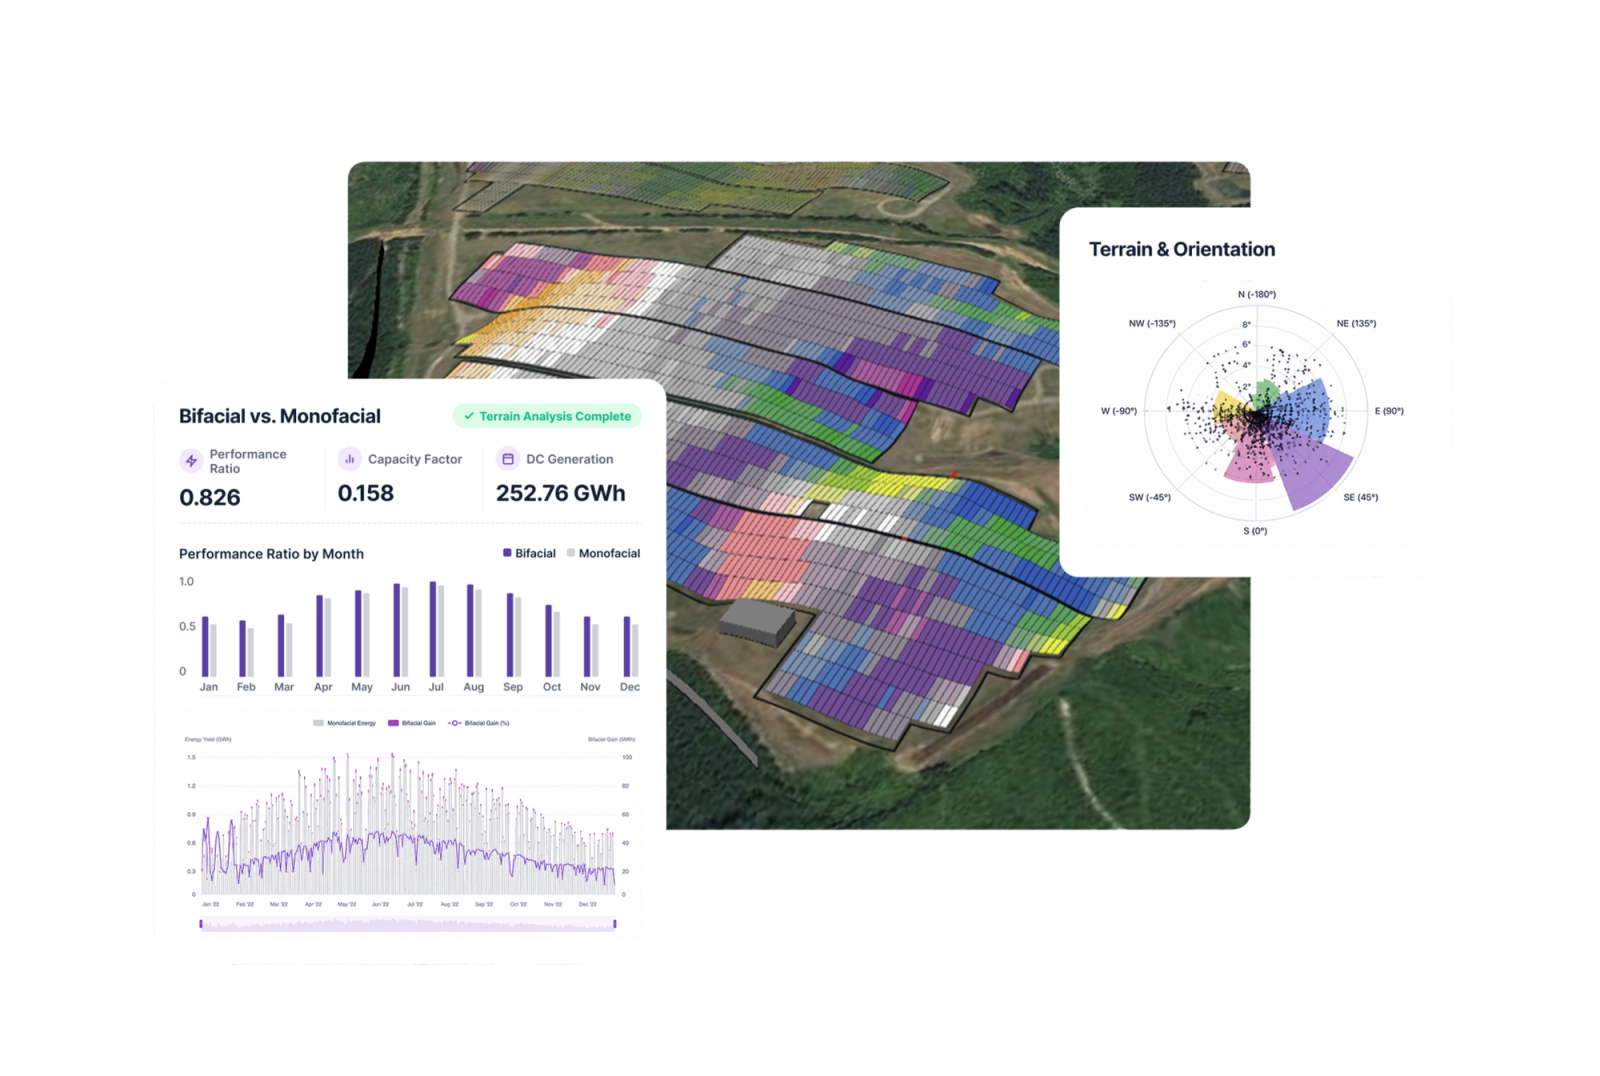
Design and optimize assets with a high-fidelity digital twin to pinpoint expected energy output, modelled to cell-level accuracy.
- Terrain-aware simulations
- Capacity testing analysis to de-risk COD
- 11% increase to specific yield gain
Minutely, String-Level Analysis
Surface and resolve DC health issues the moment they occur. Recover revenue living in the data.
- Multi-meteo irradiance modelling
- Normalized peer-to-peer comparisons
- Expected vs actual analysis at every component
Root-Cause Loss Detection
Flag exactly when, where, and why performance begins to diverge with automated loss analysis.
- Isolate recoverable from non-recoverable losses
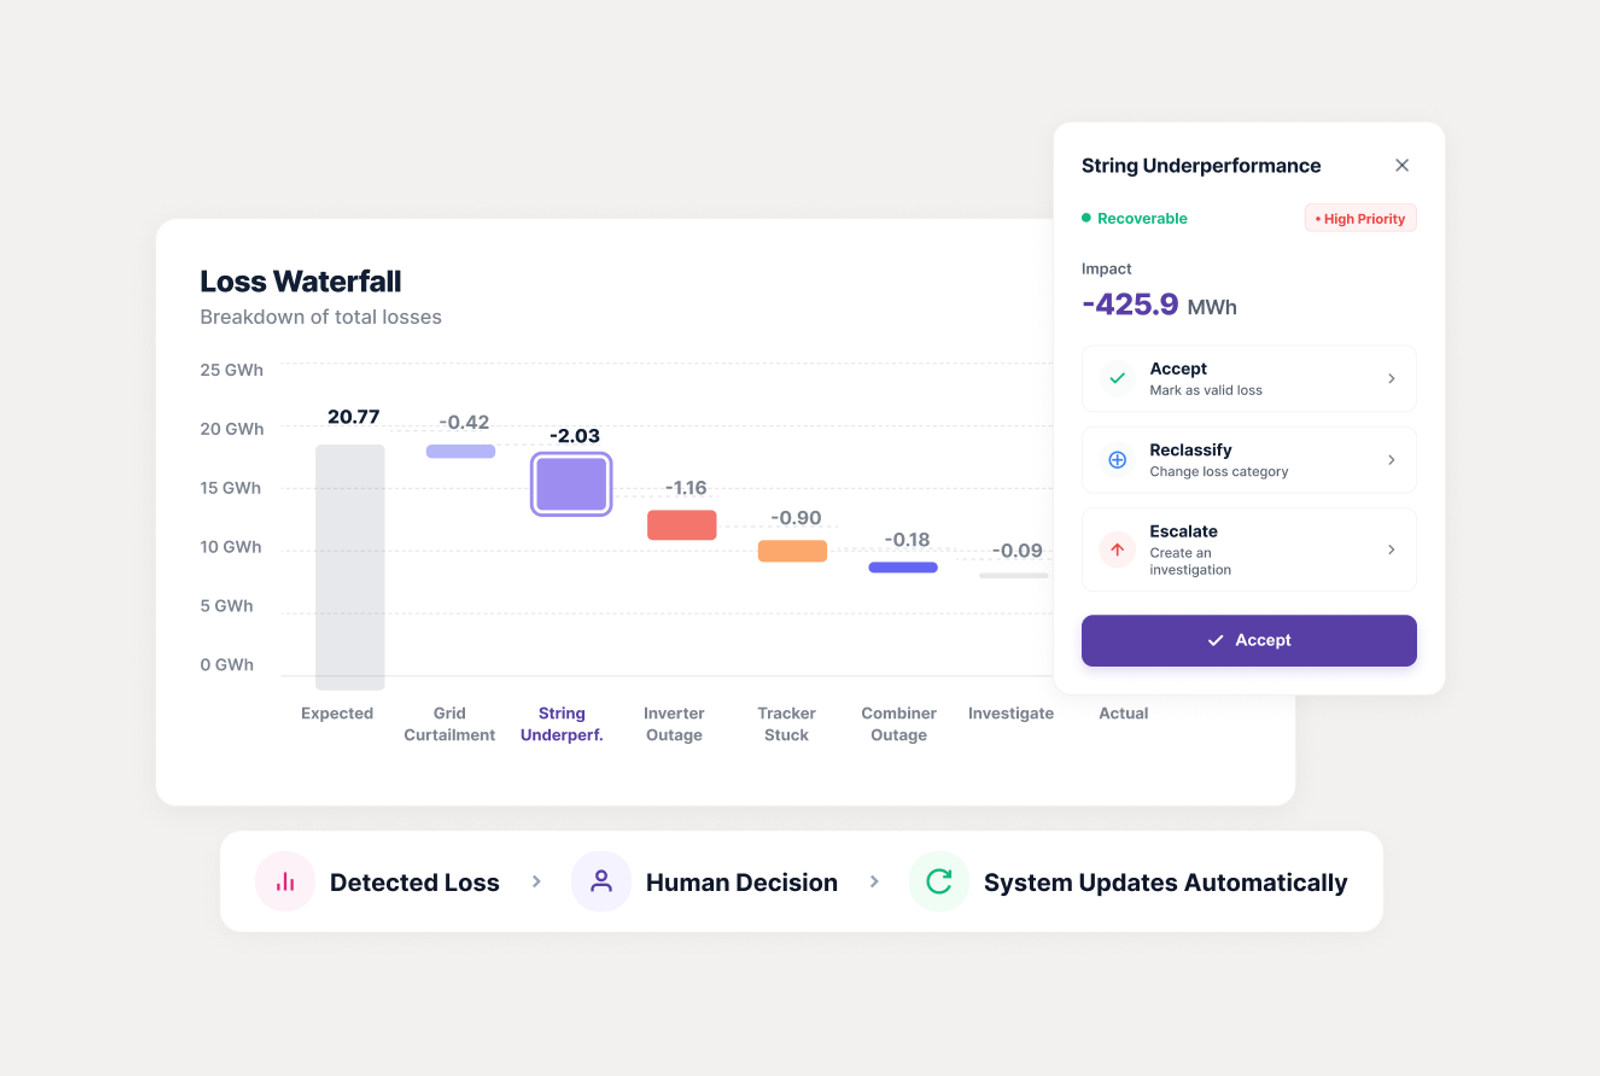
- Rank issues by MWh and dollar impact
- Integrate with CMMS to automate action
A Single Source of Truth
Enforce model continuity across asset lifecycle. Set a portfolio-wide standard of excellence and scale with confidence.
- Automated reporting and action plans
- Detailed performance track record
- Proven systems for operational excellence
DUET's 3D physics-based engine redefines accuracy and granularity
Maximize performance at every phase of the solar asset lifecycle.
Establish a breakthrough performance baseline
3D modeling built for the real world—capturing an asset's true performance capability.
Leveraging DUET's 3D model for design optimization resulted in an 11% increase in specific energy yield with terrain-aware site optimization.
Catch issues before COD, not after
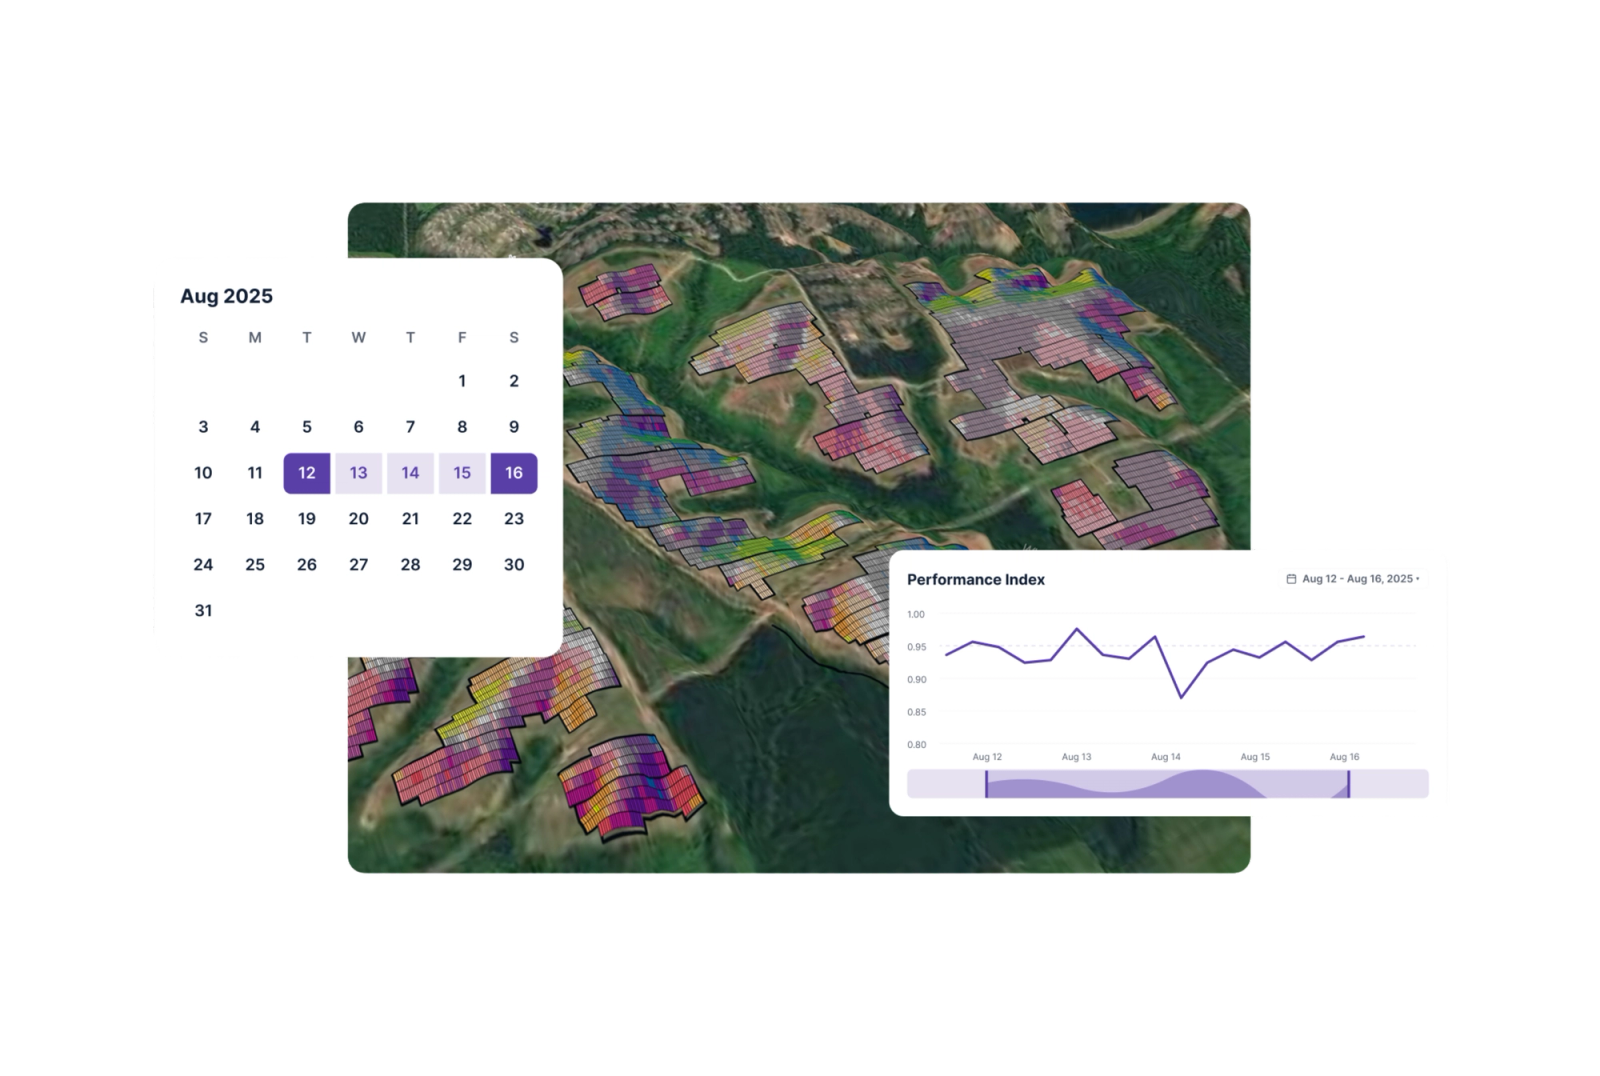
Operational analysis from the moment equipment comes online, with complete model continuity.
DUET identified a $165k/month production leak within 24 hours of deployment on a distressed asset that had been failing capacity testing for years.
Achieve operational excellence every day
Unparalleled granularity in analysis and reporting makes excellence achievable every minute of every day.
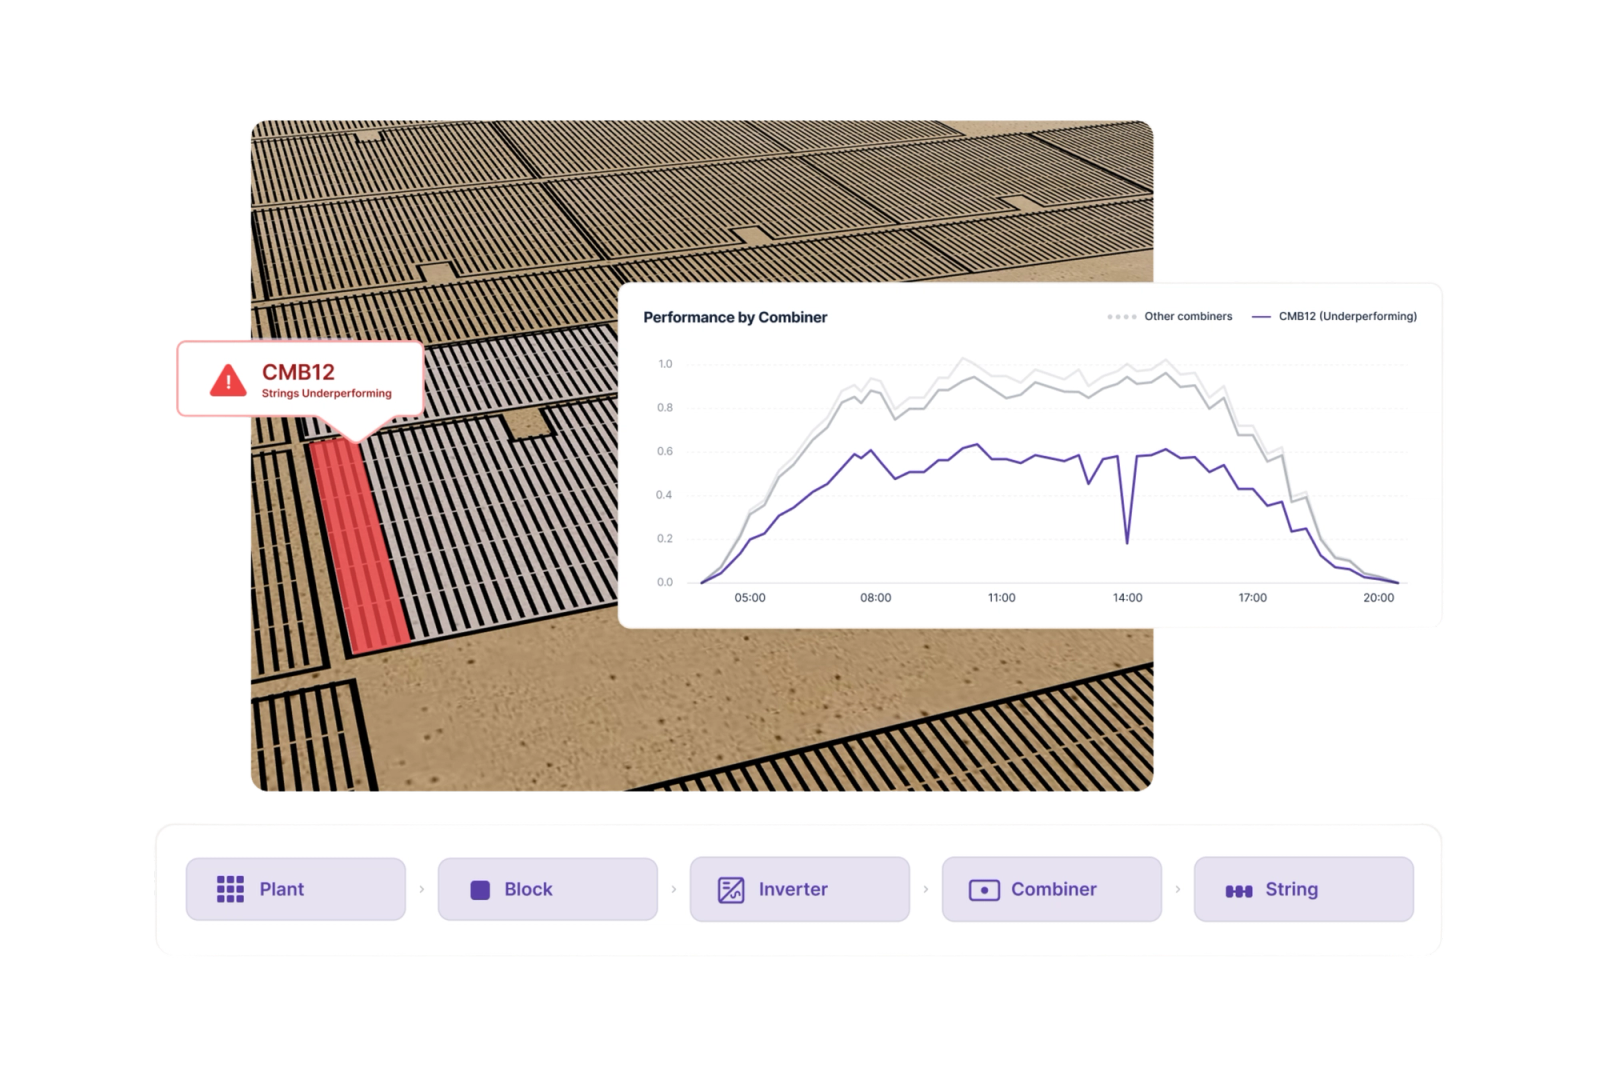
DUET isolated offline strings due to blown fuses and module disconnects days after a drone flyover gave the all-clear, and prevented 364 days of offline strings.
Augment your existing ecosystem
Connect DUET to the tools powering your everyday operations.









Direct OPC UA Connections
Integrate DUET with existing plant infrastructure with secure OPC UA connections.

On-premise Deployments
Run DUET within your own infrastructure to support enterprise security, data governance, and deployment requirements.
99% availability is
achievable and maintainable.
Turn every deviation into a prioritized fix, automatically. DUET gives you granular analysis to maximize performance across your entire portfolio.
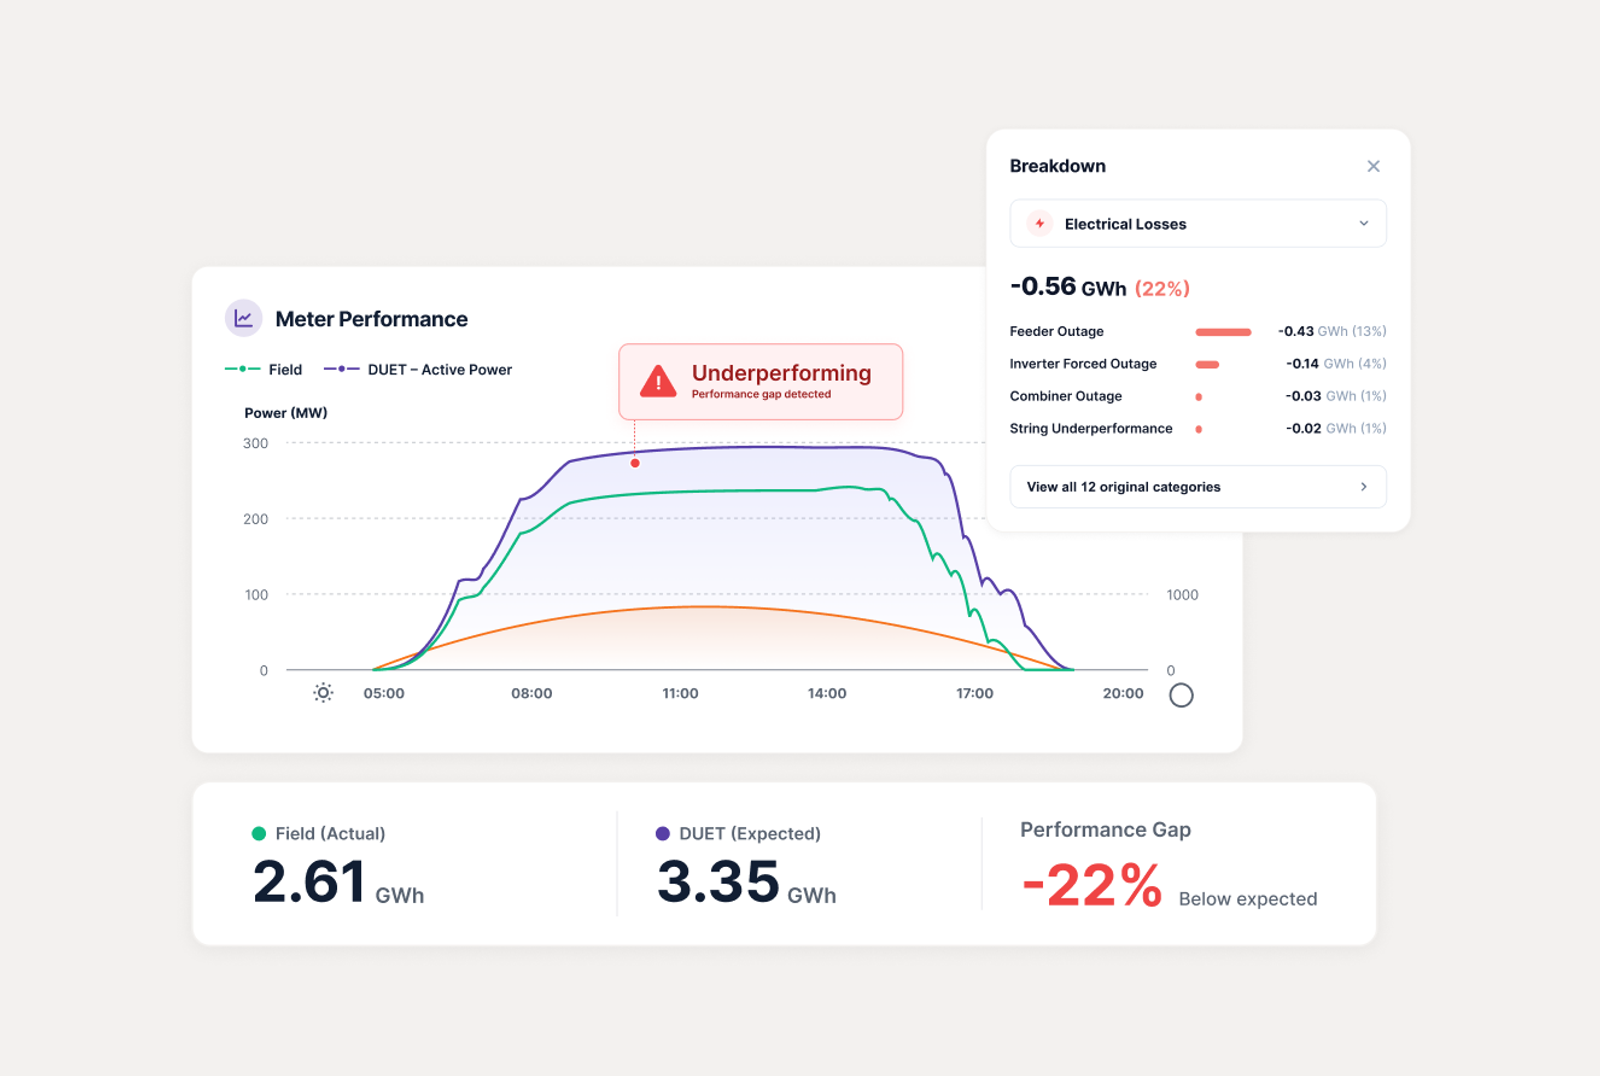
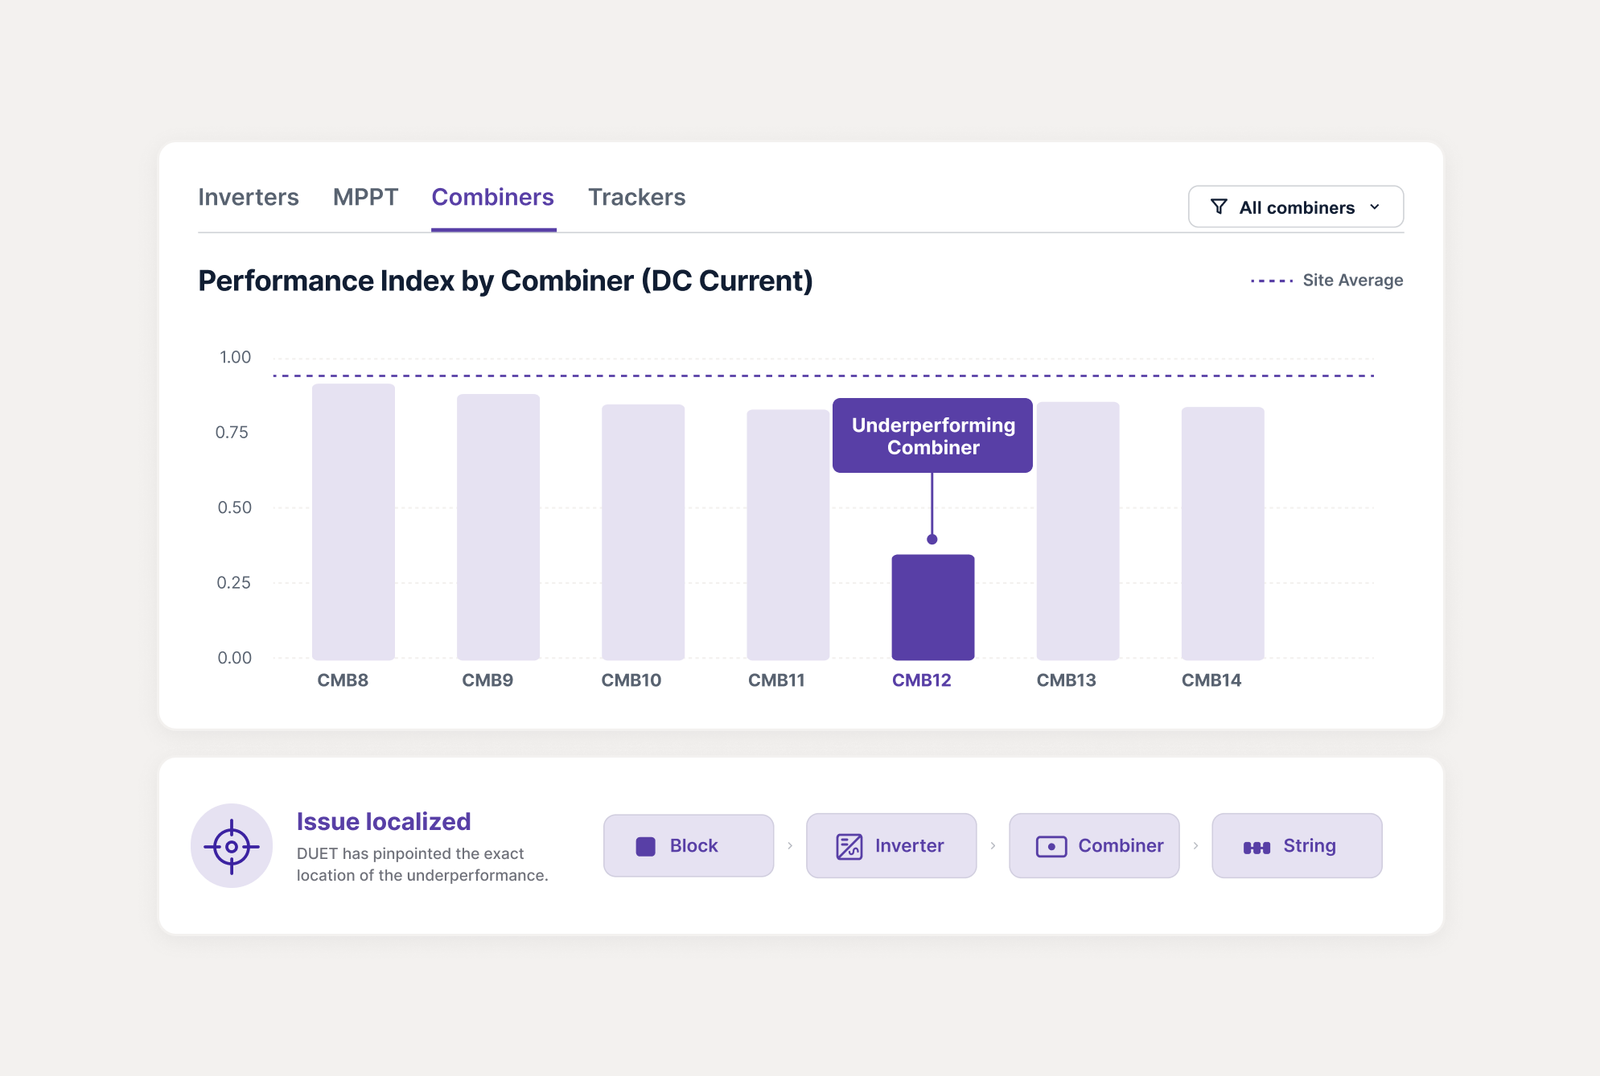
Detect
DUET uses next-generation 3D modelling to establish a trusted performance baseline and automate real-time underperformance detection.
Localize
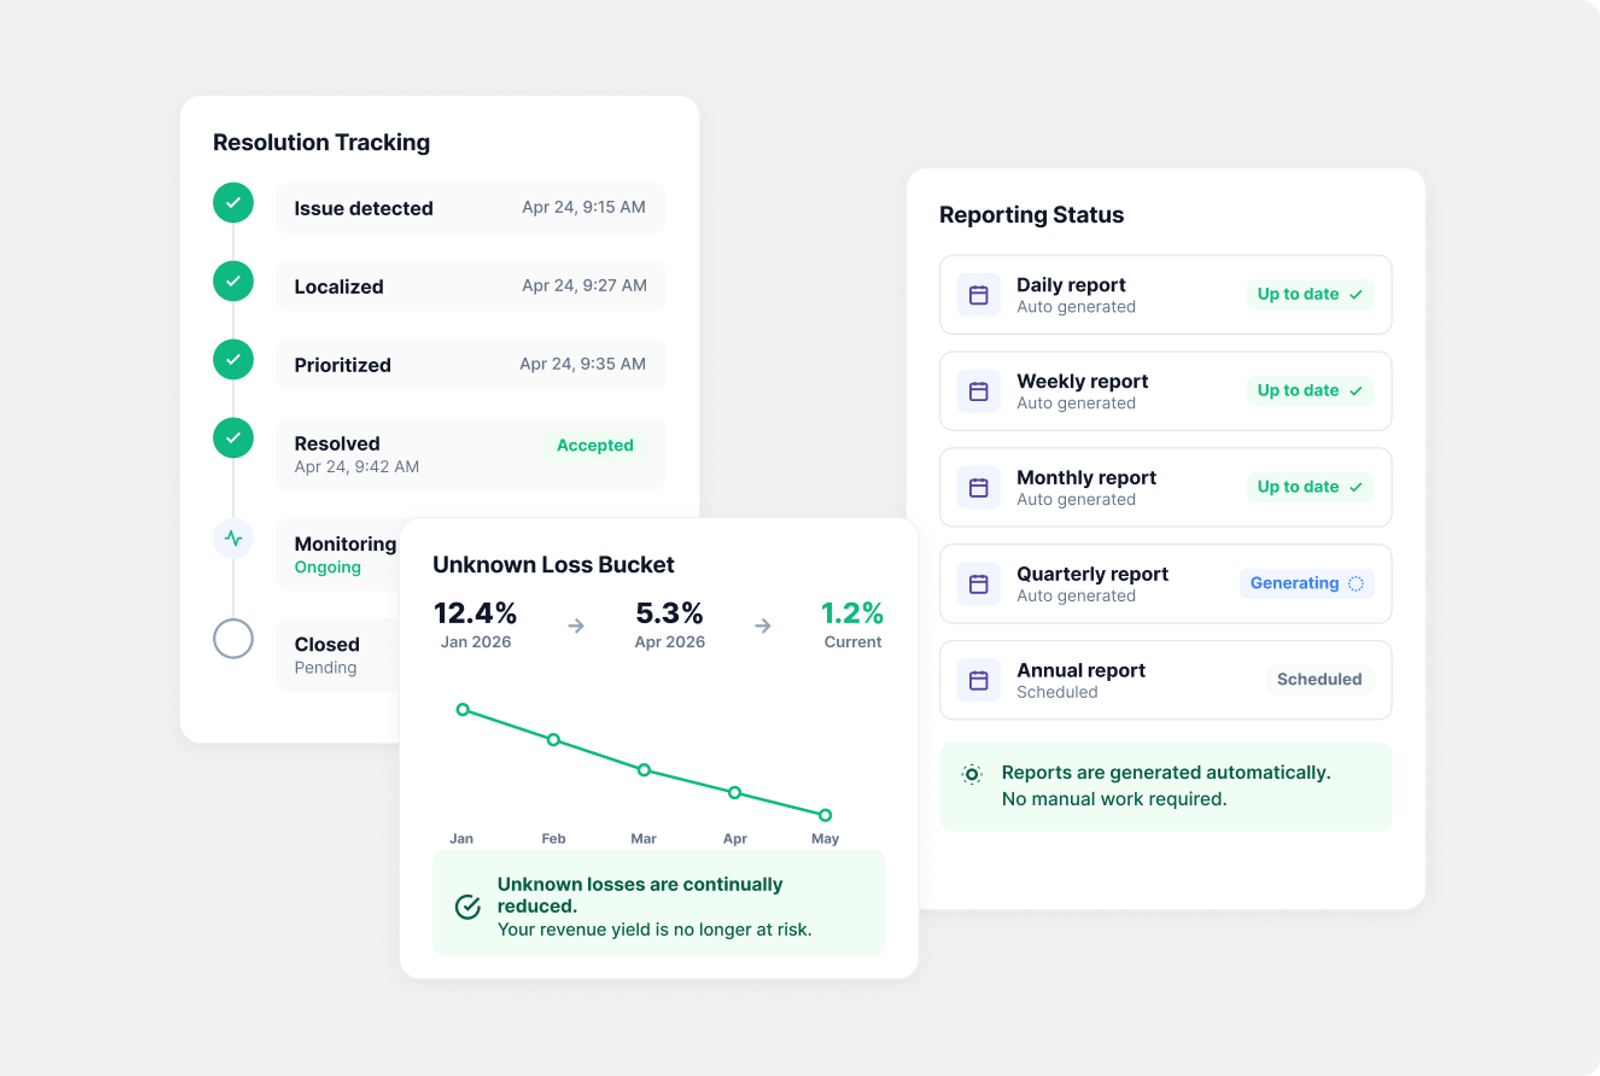
Drill down from meter to string and identify exactly when and where losses originate to ensure continuous operational excellence.
Action
Escalate events with automated action plans. Diagnose, prioritize, and resolve every issue rapidly, ensuring P50 is reliably met.
Report
DUET ranks every loss by dollar impact with a real-time loss waterfall. Automate daily, weekly, and monthly reporting and eliminate performance leaks.
Detect
DUET uses next-generation 3D modelling to establish a trusted performance baseline and automate real-time underperformance detection.
Localize
Drill down from meter to string and identify exactly when and where losses originate to ensure continuous operational excellence.
Action
Escalate events with automated action plans. Diagnose, prioritize, and resolve every issue rapidly, ensuring P50 is reliably met.
Report
DUET ranks every loss by dollar impact with a real-time loss waterfall. Automate daily, weekly, and monthly reporting and eliminate performance leaks.
Enurgen combines scientific research, engineering expertise, and real-world operational experience to build technologies that deliver increased yields and operational excellence.
Fast Track Operational Excellence
Run a full loss analysis with DUET. 3 sites. 60 days. Prioritized action plans to recover revenue.