Webinar
Find the missing losses in your solar plants with Wood and Enurgen, live November 17 or on replay
Register now
Asset Managers

Know where every MWh went, and what it cost.

Eliminate unknown losses, and see exactly which ones are recoverable and what each one is worth. Prioritize fixes by dollar impact, and track progress toward P50.

Get a sample report
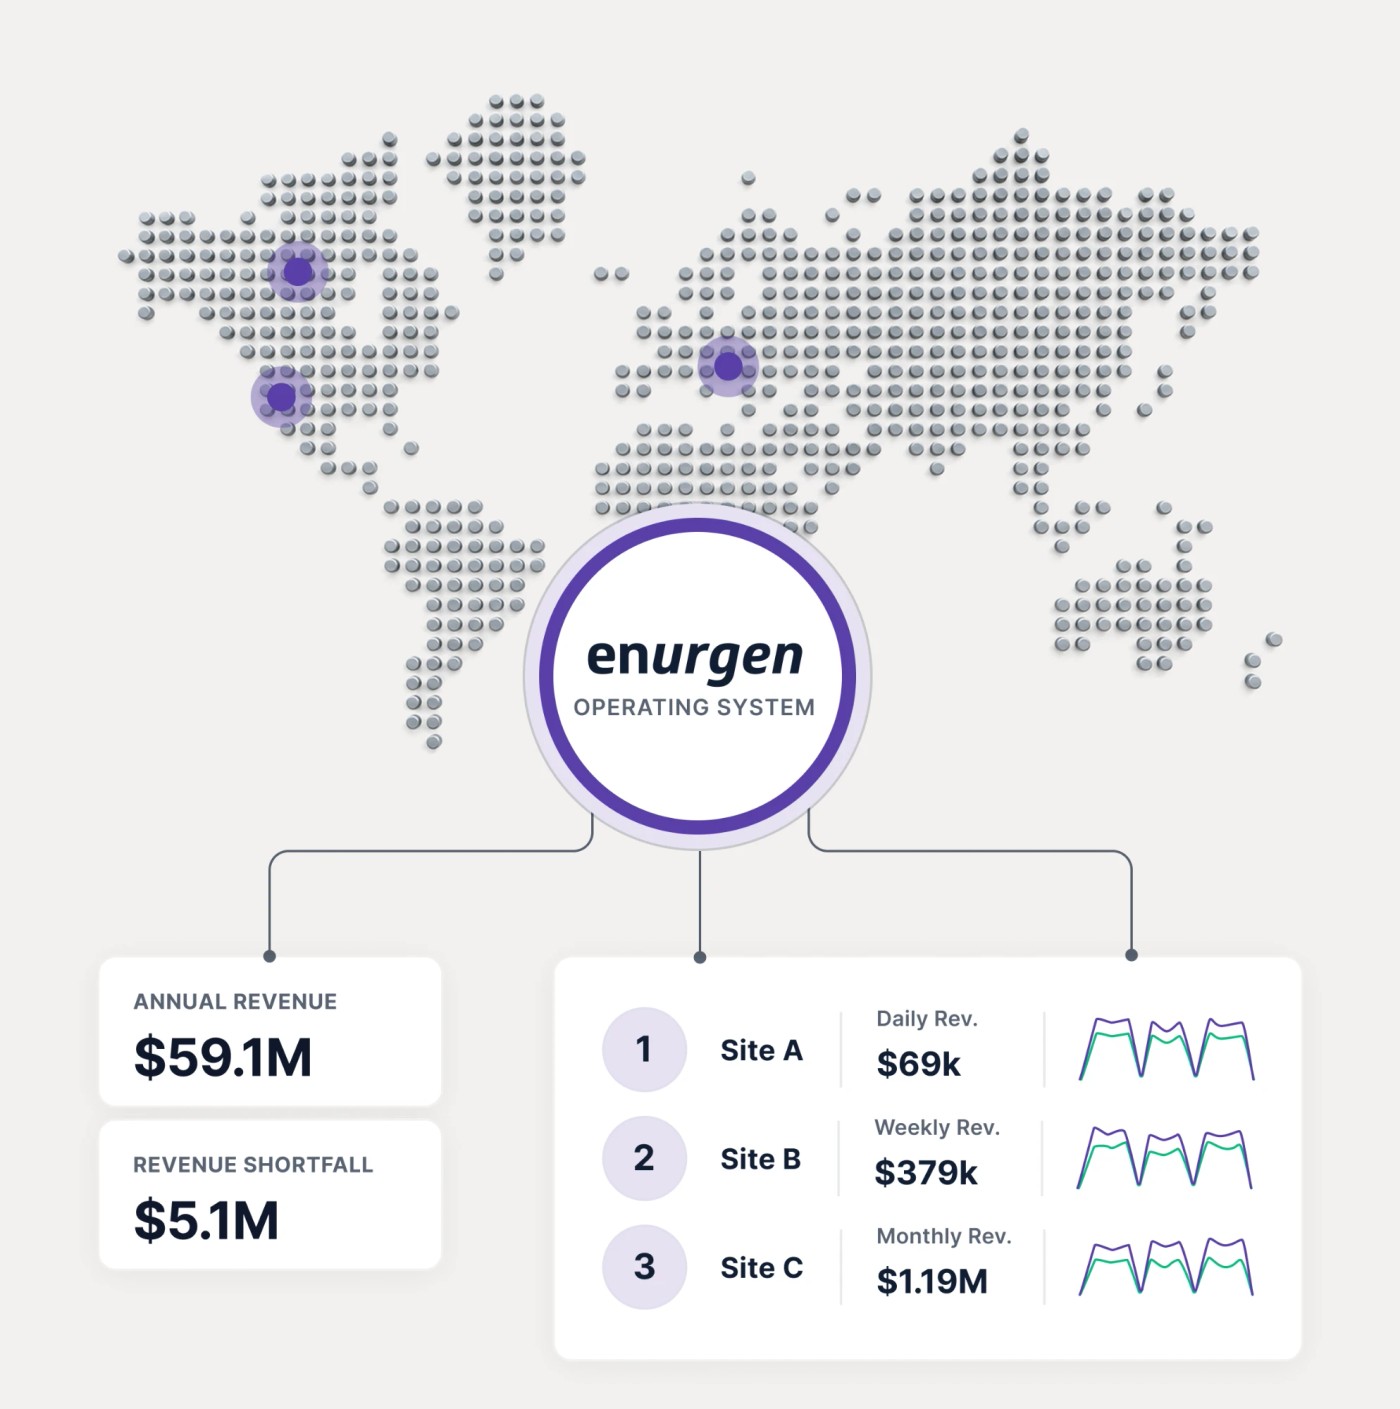
World map of dots with the Enurgen Operating System at the centre, linked to annual revenue and revenue shortfall figures and a ranking of Sites A, B and C by daily, weekly and monthly revenue

Every portfolio has a gap between budgeted, expected, and
actual yield. EnurgenOS accounts for every loss, and shows
what can be recovered.

Sites fall short of budget and expected yield, while reports only explain a fraction of the loss.

Account for every MWh, and bridge the gaps between budget, expected, and actual yield with detailed loss waterfalls.
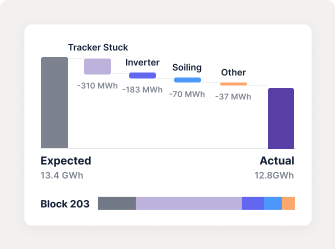
Loss waterfall from 12.0 GWh expected to 7.6 GWh actual, broken down into tracker stuck, inverter, soiling and other losses

Losses that look identical in MWh can carry very different costs under each site's PPA.

Price every loss against its contract, including penalties and time-based pricing.
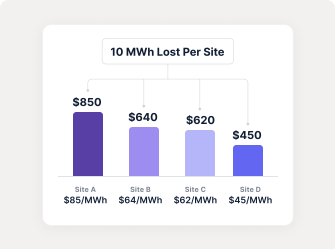
Bar chart showing the same 10 MWh lost at four sites costing $850, $640, $620 and $450 under different PPA prices

Expected targets feel out of reach because teams don't know what to fix first.

Flag issues as they happen, with automated daily action plans from a trusted model, prioritized by MWh and dollar impact.
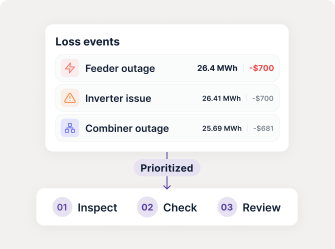
Loss events list with feeder outage, inverter issue and combiner outage, prioritized into inspect, check and review steps

Every loss explained, every fix prioritized.

Identify, assess, and capture every recoverable loss. With automated reporting and action plans, the gap to expected yield becomes revenue you can act on.

Dollar-impact ranking

Tie every loss to your PPA contract.

Rank every loss by revenue impact, so limited spend goes where it recovers the most yield first.
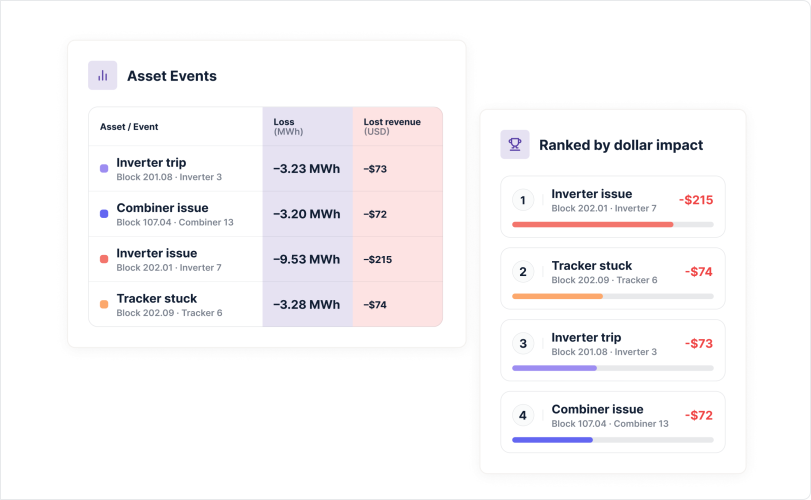
Asset events table of losses in MWh and lost revenue, next to events ranked by dollar impact
Detailed loss waterfalls

Automated reports, in your inbox

Get automated daily, weekly, monthly reports in your inbox. Share performance, losses, and dollar impact for every site with owners, investors, and lenders.
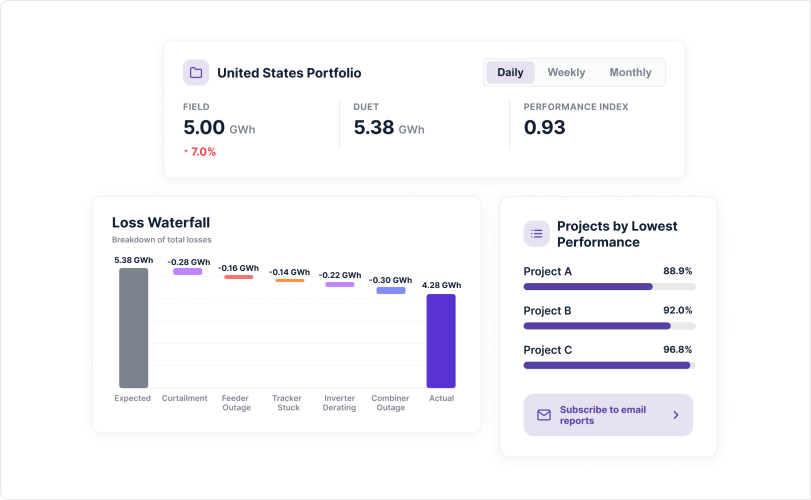
United States portfolio summary with a loss waterfall and projects ranked by lowest performance
Closed-loop resolution

Meet and exceed expected targets.

Track every issue from detection to fix, and watch recovered yield trend closer to target in every report.
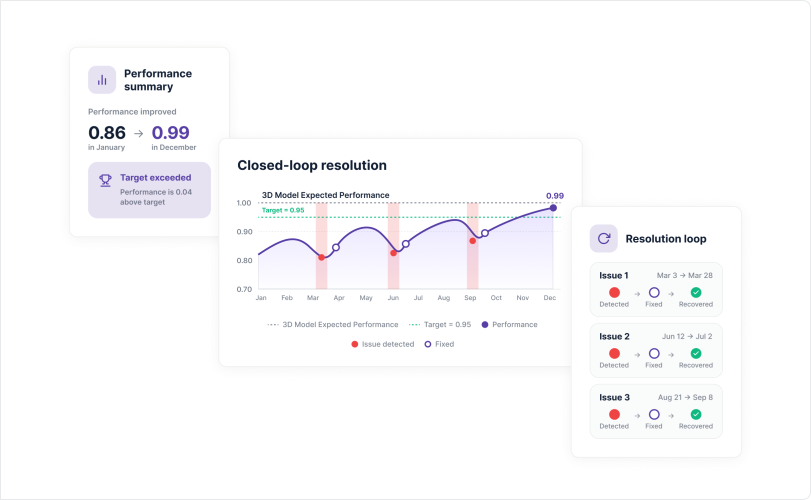
Performance summary and a closed-loop resolution chart showing yield recovering to target, with issues tracked from detected to recovered

See the revenue your current reporting can't.

3 sites. 60 days. Your best performer, your worst, and one in the middle. Every issue measured against budget and ranked by dollar impact.

See the impact on your portfolio