Webinar
Find the missing losses in your solar plants with Wood and Enurgen, live November 17 or on replay
Register now
Performance Engineers

String-level modeling for root-cause loss analysis.

Identify the source of every deviation with automated performance reporting and loss attribution. Save weeks of manual data collection, and integrate directly with your CMMS to prioritize work orders by dollar impact.

Get a sample diagnostic
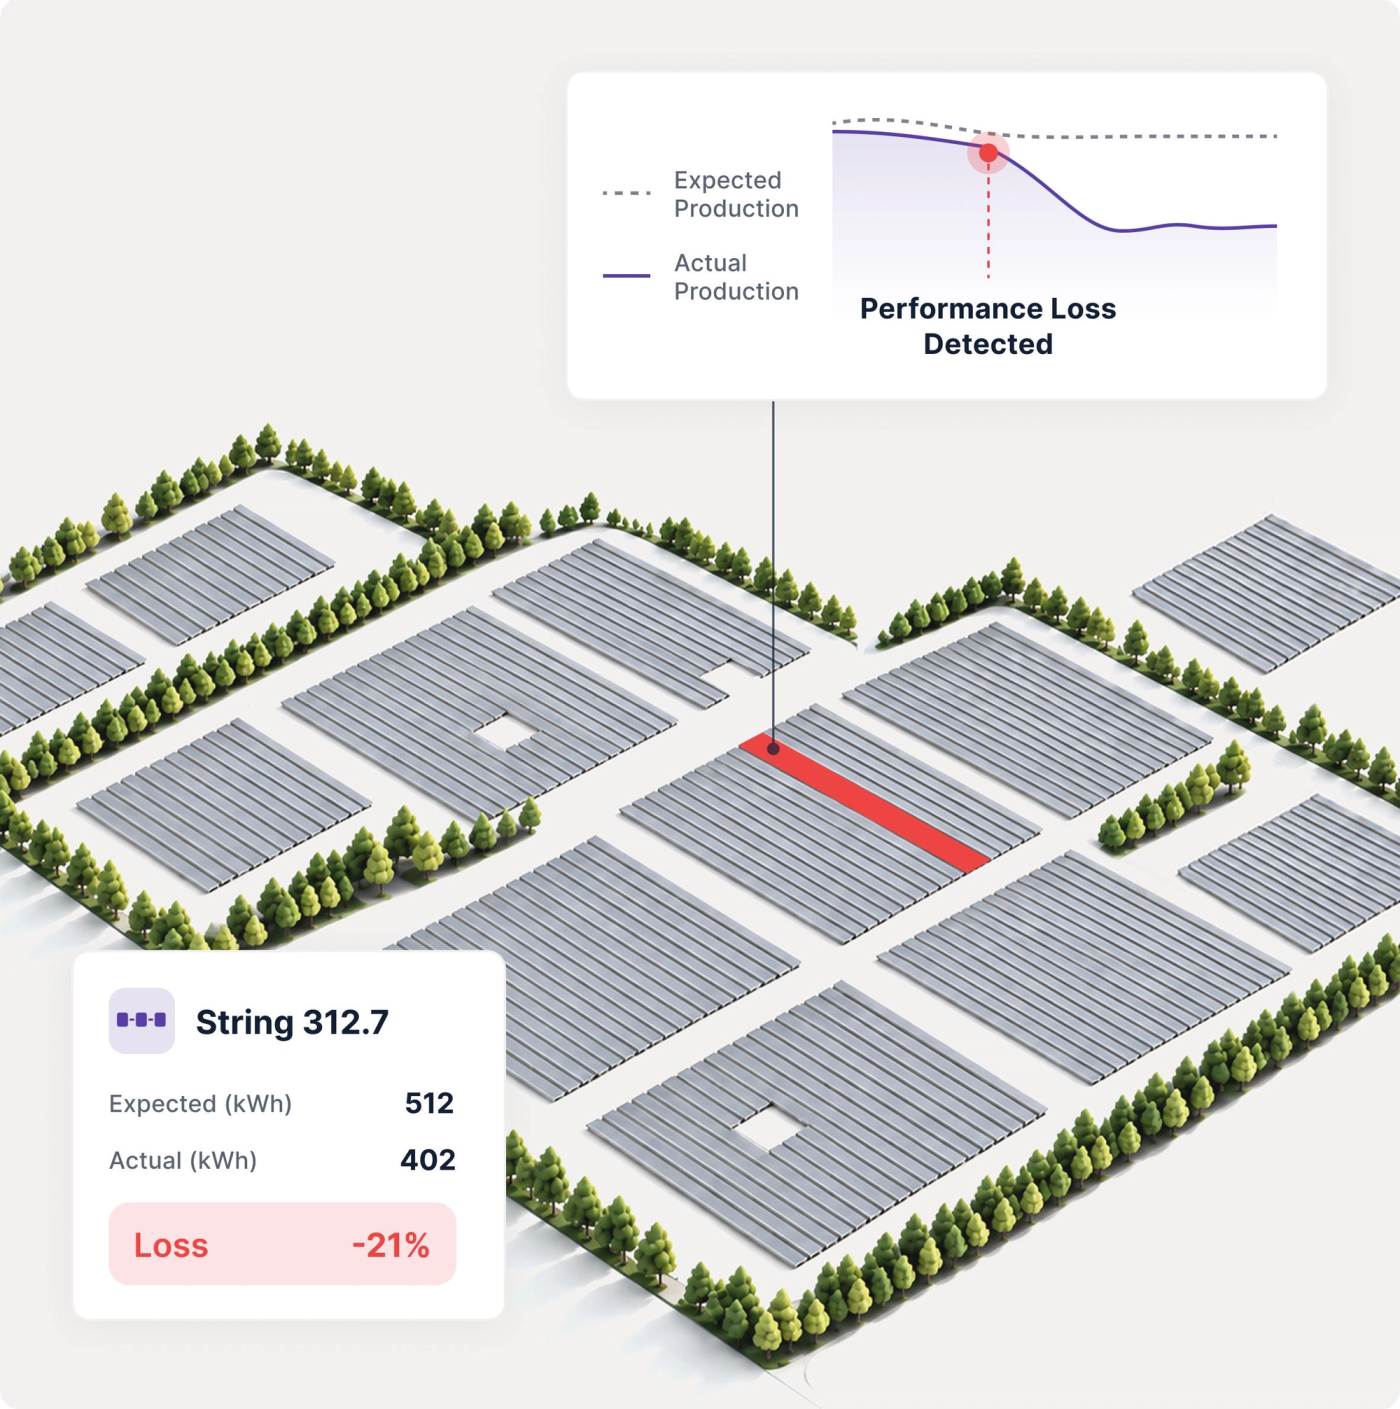
Aerial view of a solar site with one underperforming string highlighted, showing its expected versus actual output

Pre-construction estimates rarely match actual energy yield.
EnurgenOS explains the gap and helps you close it.

Field teams need a target they trust is attainable, and management needs every deviation explained.

Solve unknown losses with accurate loss accounting based on a trusted expected production model.
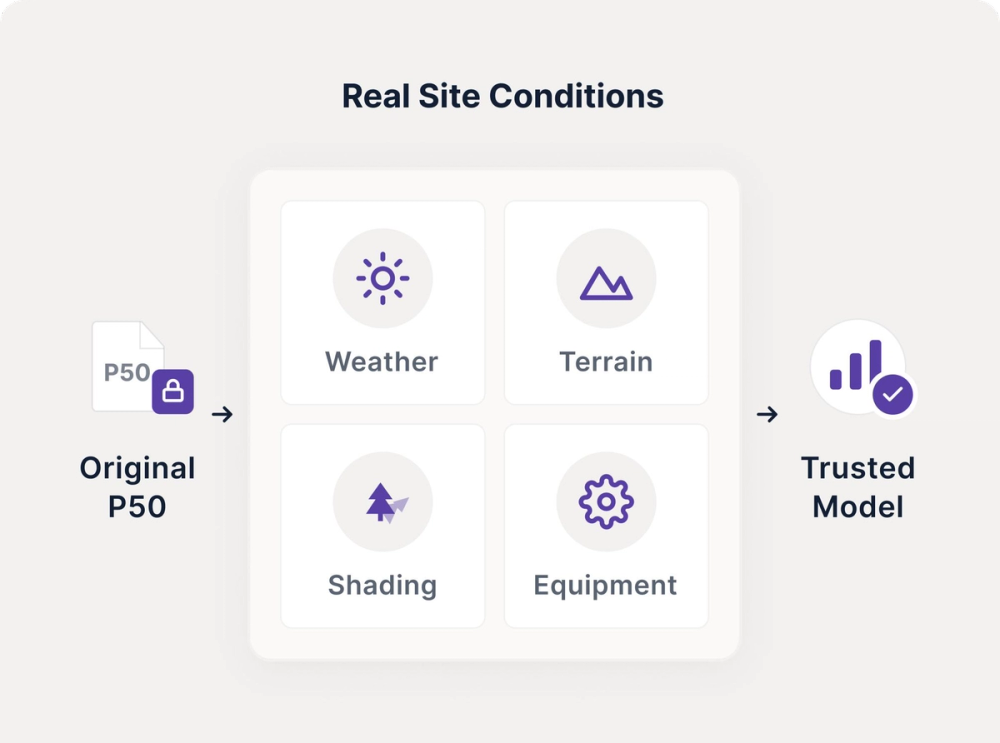
The original P50 adjusted for real site conditions — weather, terrain, shading and equipment — into a trusted model

P50 targets are set before construction and rarely touched again.

Measure performance against real site conditions, and show exactly why it differs.
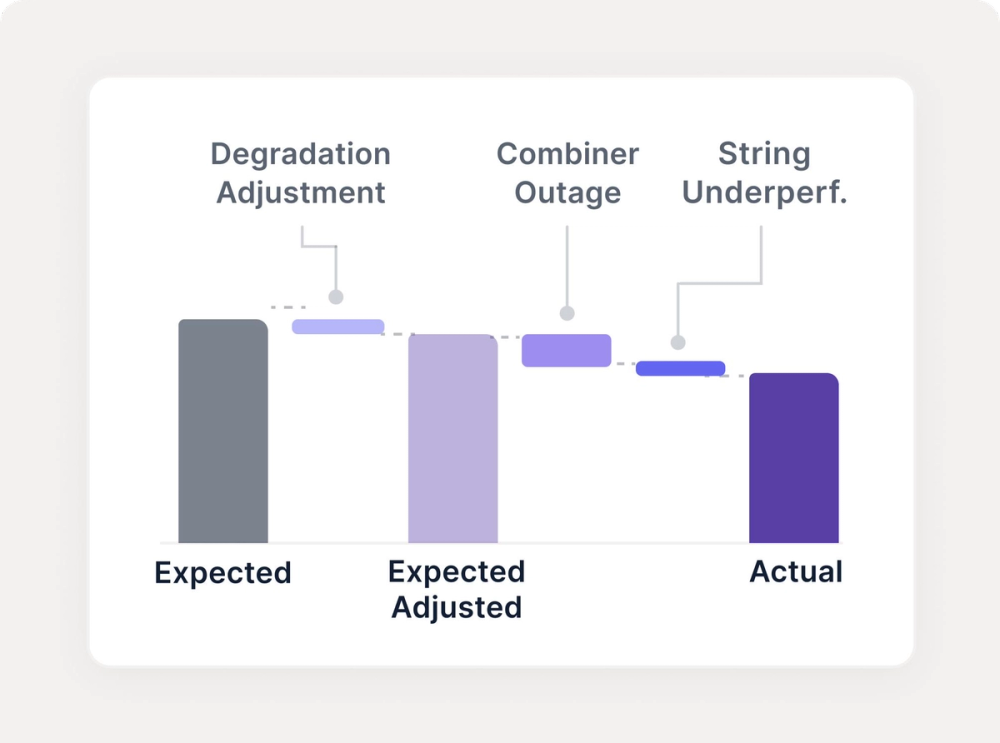
Waterfall chart breaking the gap between expected and actual output into degradation, combiner outage and string underperformance

Monitoring tools only surface faults, they don't explain underperformance.

Compare every block, combiner, and string to its own expected output, and flag deviations the moment they happen, with root-cause explanations.
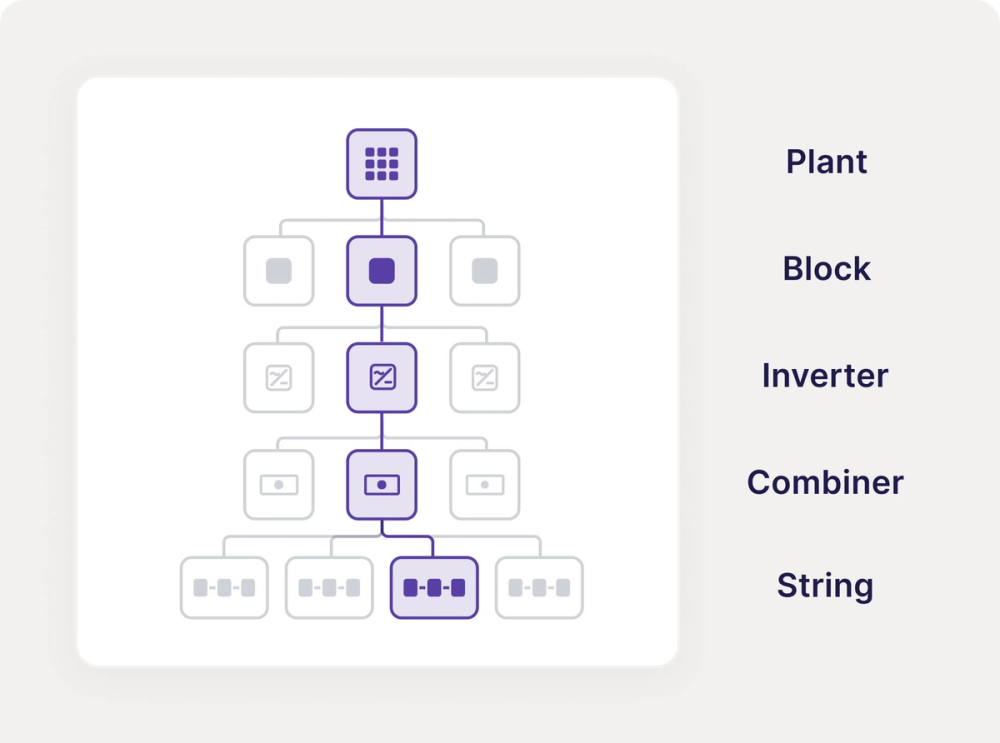
Plant, block, inverter, combiner and string hierarchy with one string highlighted

Every loss, localized and explained.

Pinpoint and quantify underperformance, with the evidence to back it up. With EnurgenOS, energy output is measured against a baseline that reflects your as-builts.

Component-level drill down

From deviation to root cause in minutes.

Trace underperformance down to the string level, with a Performance Index for every component.
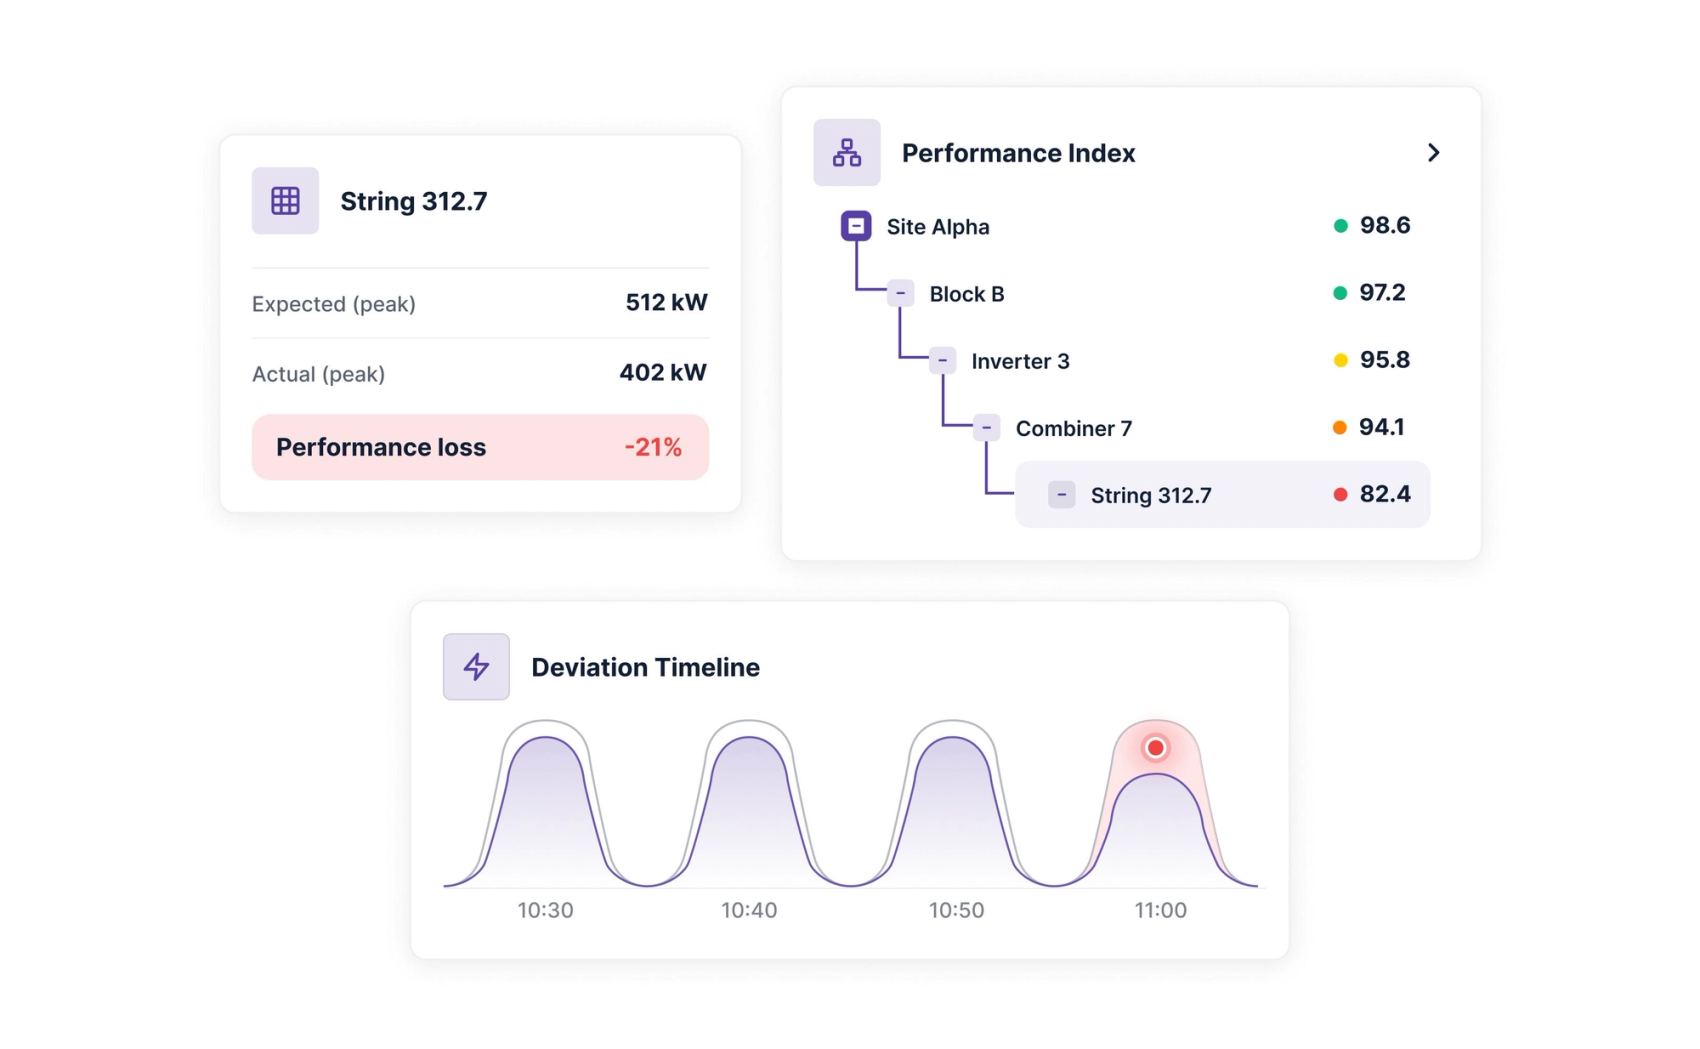
String 312.7 expected versus actual peak output, a Performance Index tree down to the string, and a deviation timeline
Loss attribution

See the reason behind every loss.

Quantify issues by MWh and dollars, tied to the raw signature, so every deviation can be verified and resolved.
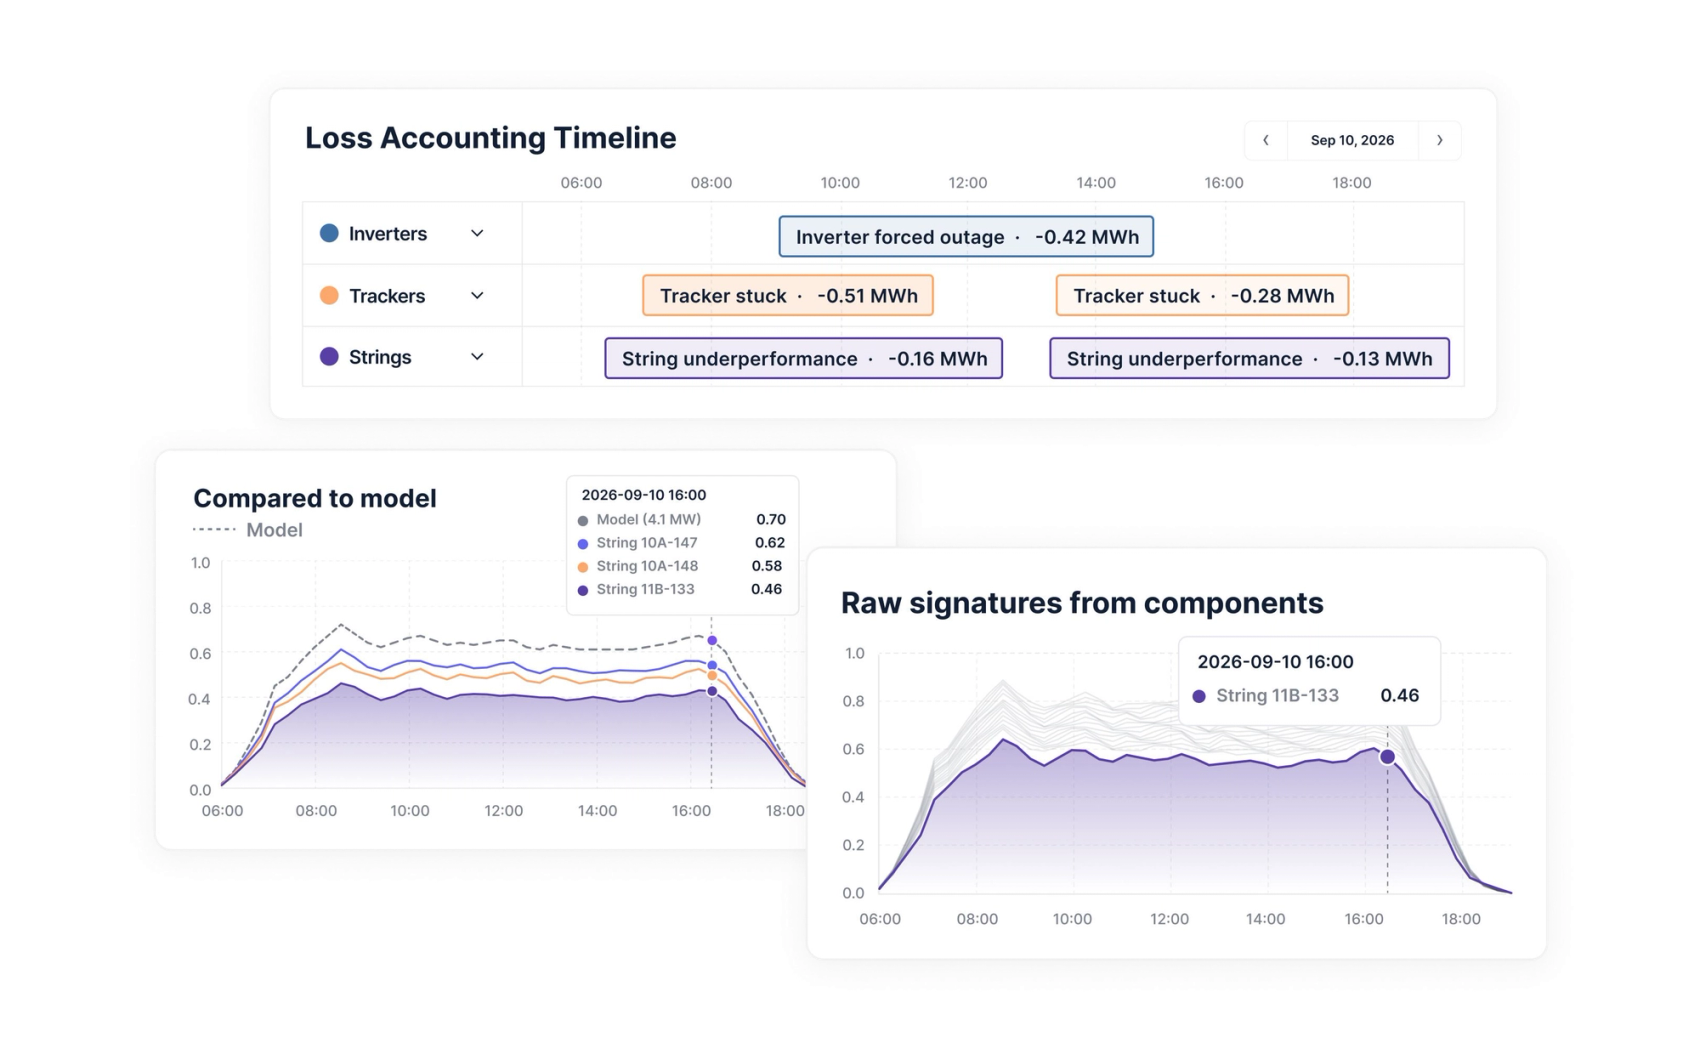
Loss accounting timeline by inverter, tracker and string, compared against the model, with raw component signatures
Site-specific baselines

Trusted models for the as-built site.

Adapt to real-world operational conditions that impact what an asset can truly produce.
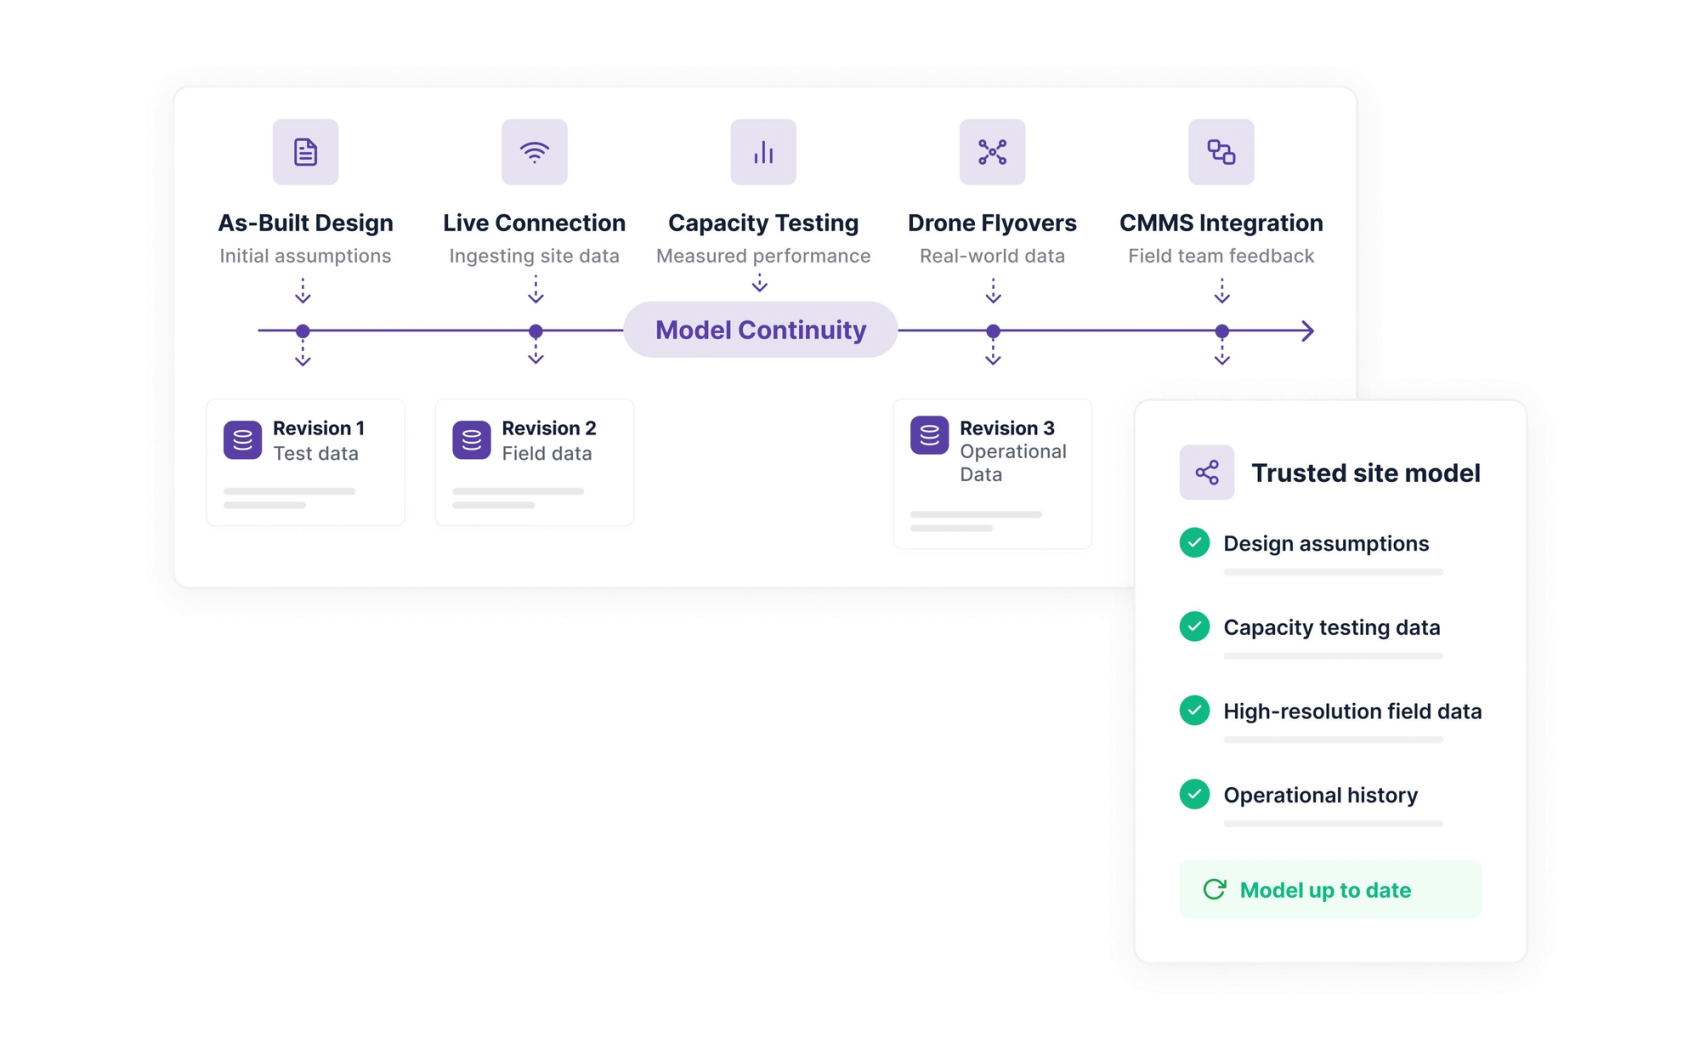
Model continuity from as-built design through live connection, capacity testing, drone flyovers and CMMS feedback into a trusted site model

Run the diagnostic your current systems can't.

3 sites. 60 days. Every deviation located, every loss priced, and a prioritized action list that shows exactly what to fix first.

See the impact even on your best site