Sites are getting more complex, and 2D models are falling behind.
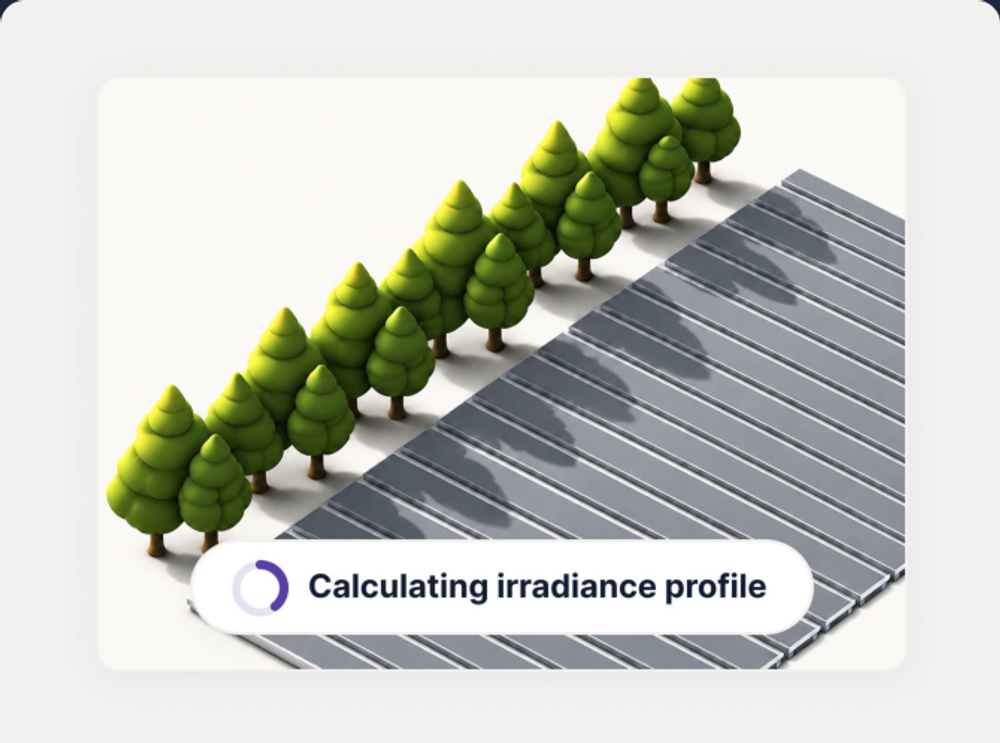
Model every site in 3D with real terrain and site-specific inputs, so contracted targets hold up from the first review.
Design, build, and test to spec with confidence. Contract on targets modeled from real-world conditions, and catch equipment issues the moment they come online.
Talk to a solar expert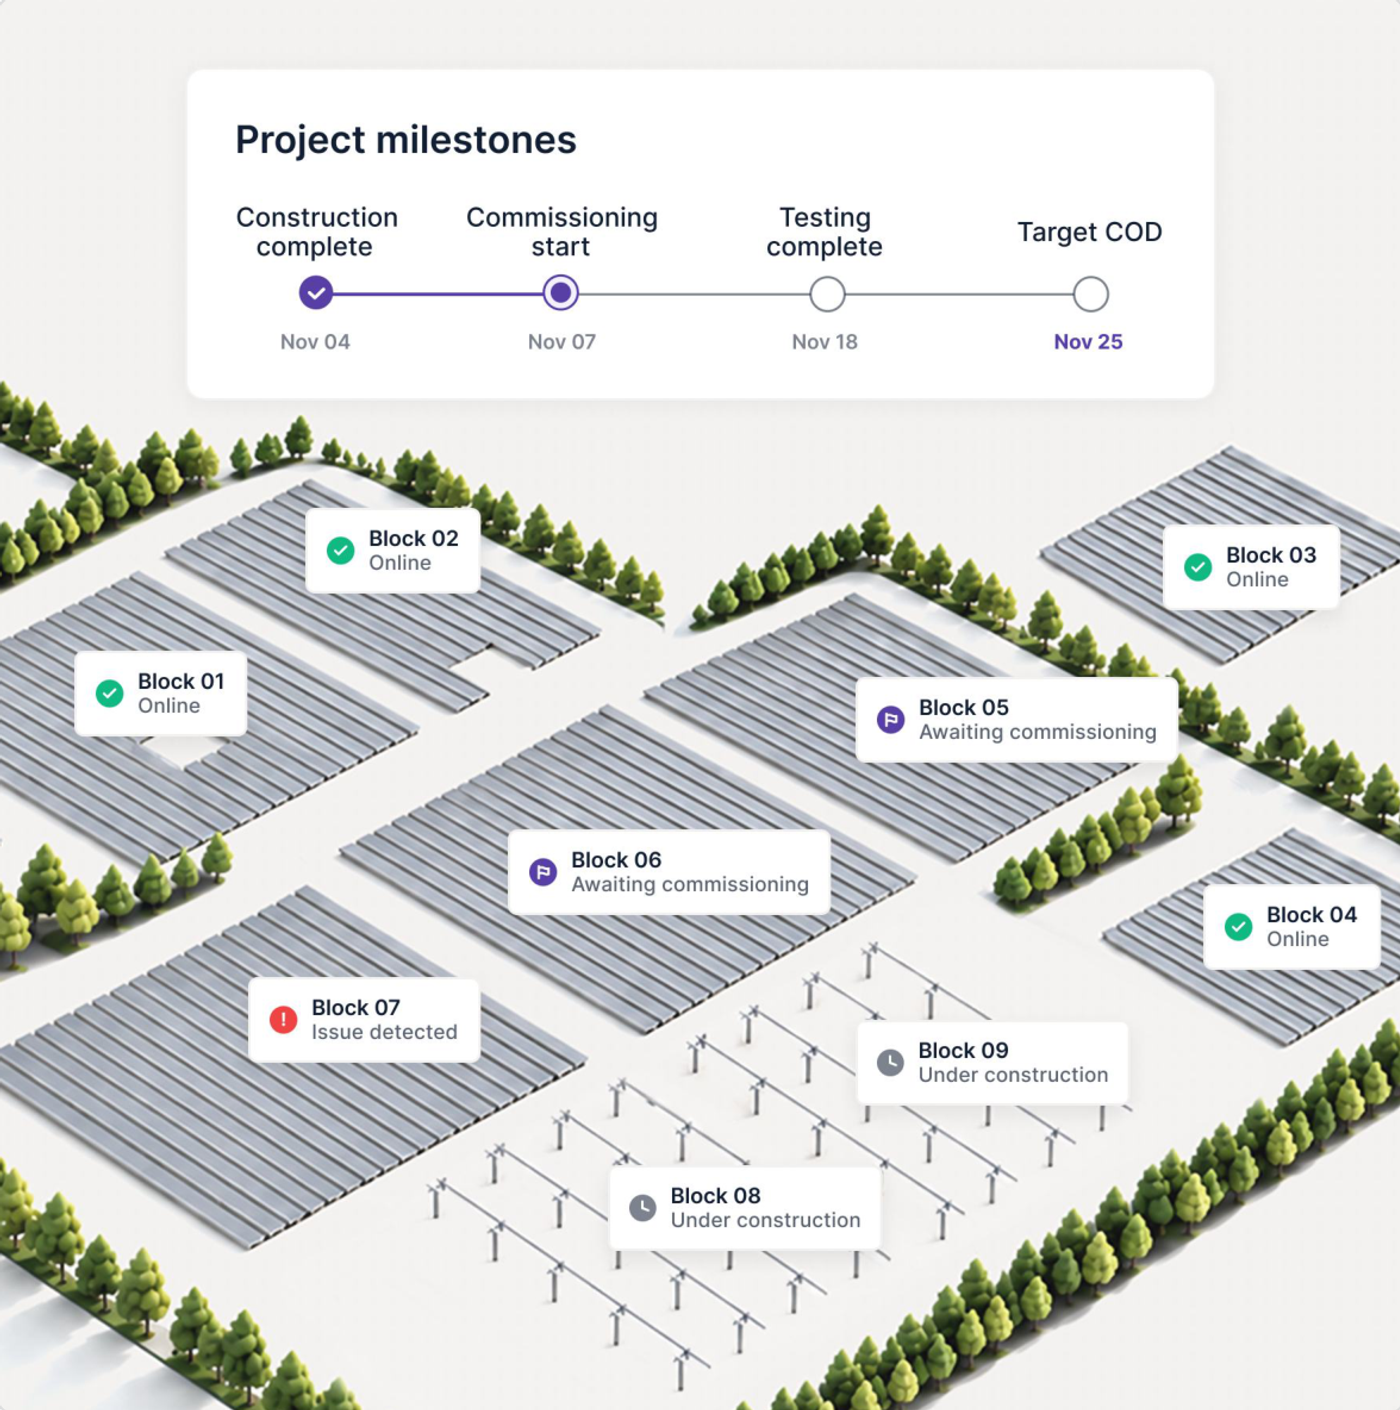







Model every site in 3D with real terrain and site-specific inputs, so contracted targets hold up from the first review.
Check plant performance as each block comes online, and go into every test knowing what to expect.
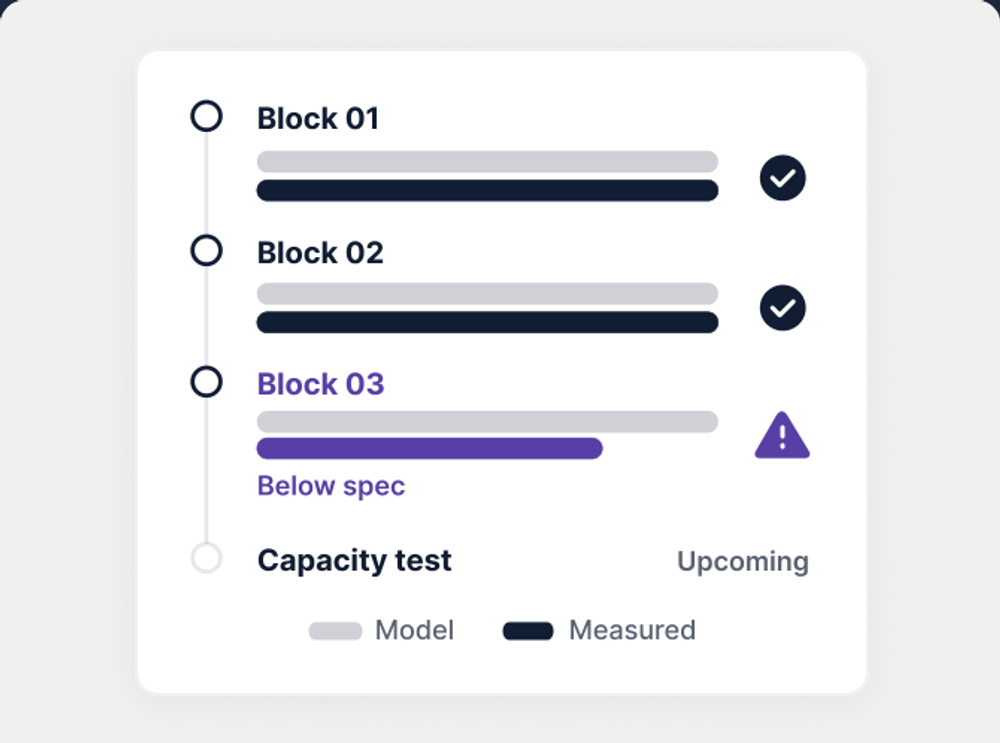
Verify performance before handover, and track contracted targets from day one of equipment energization.
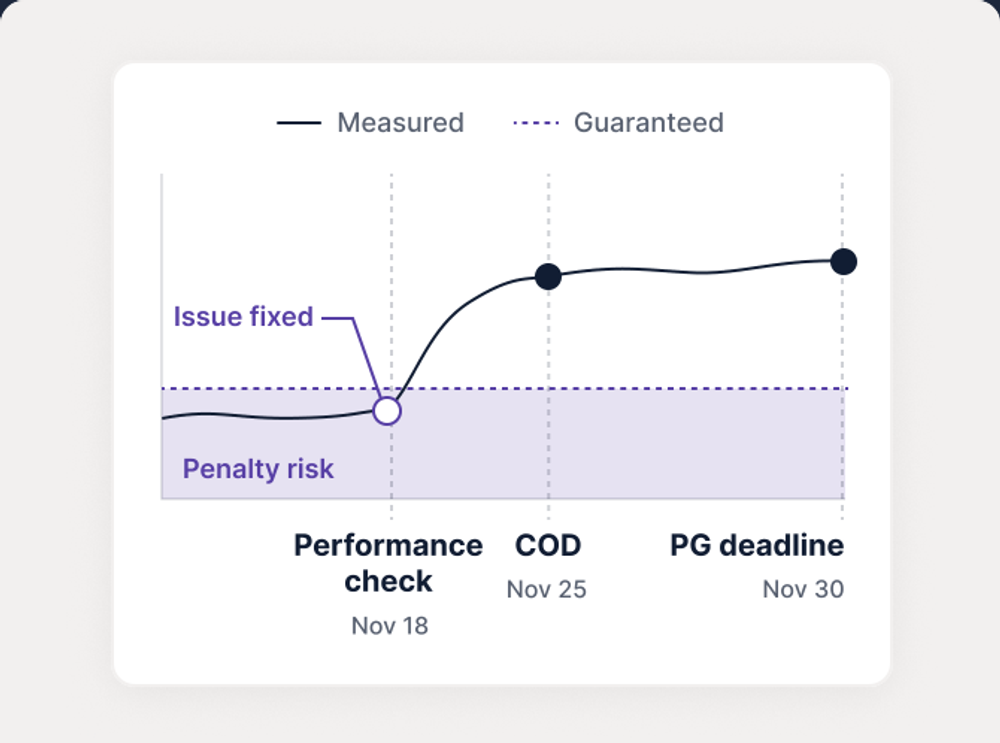
Model, test, and commission every component to modeled production target, with the data to back every result. With EnurgenOS, expected performance carries from the first simulation through to handover.
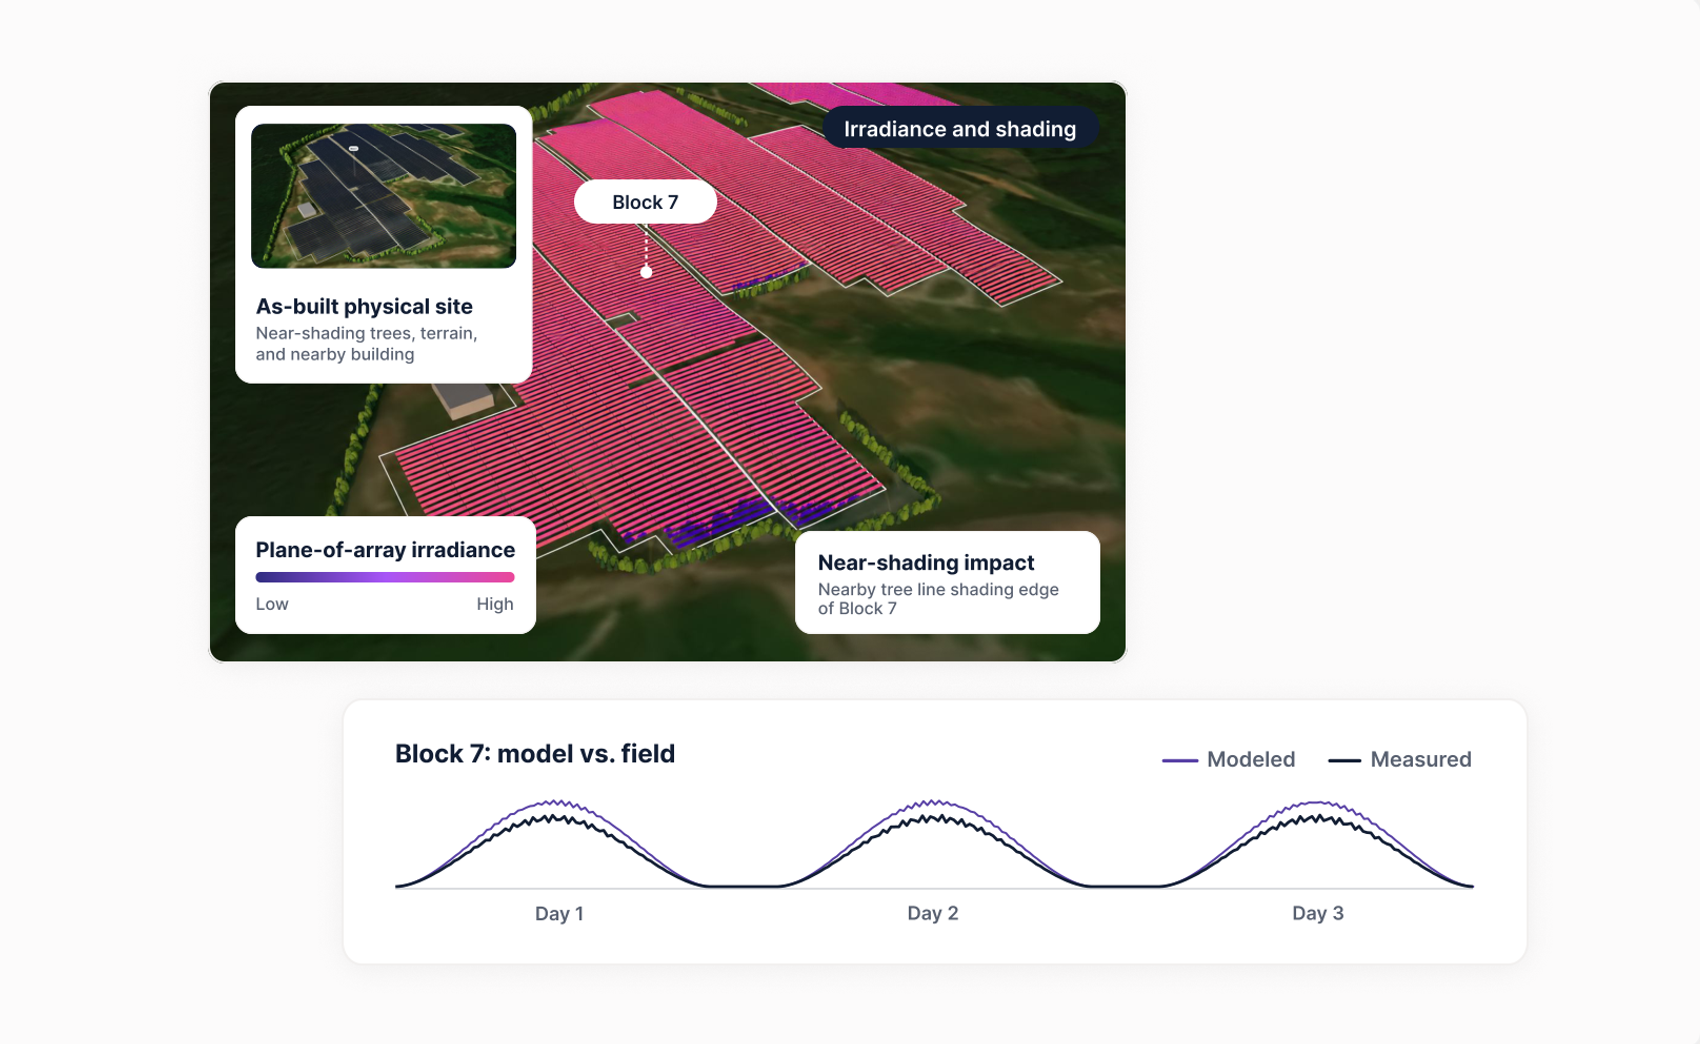
Model terrain, shading, and spectral effects in 3D, and update targets as the site is built, so modeled production always reflects what’s in the ground.
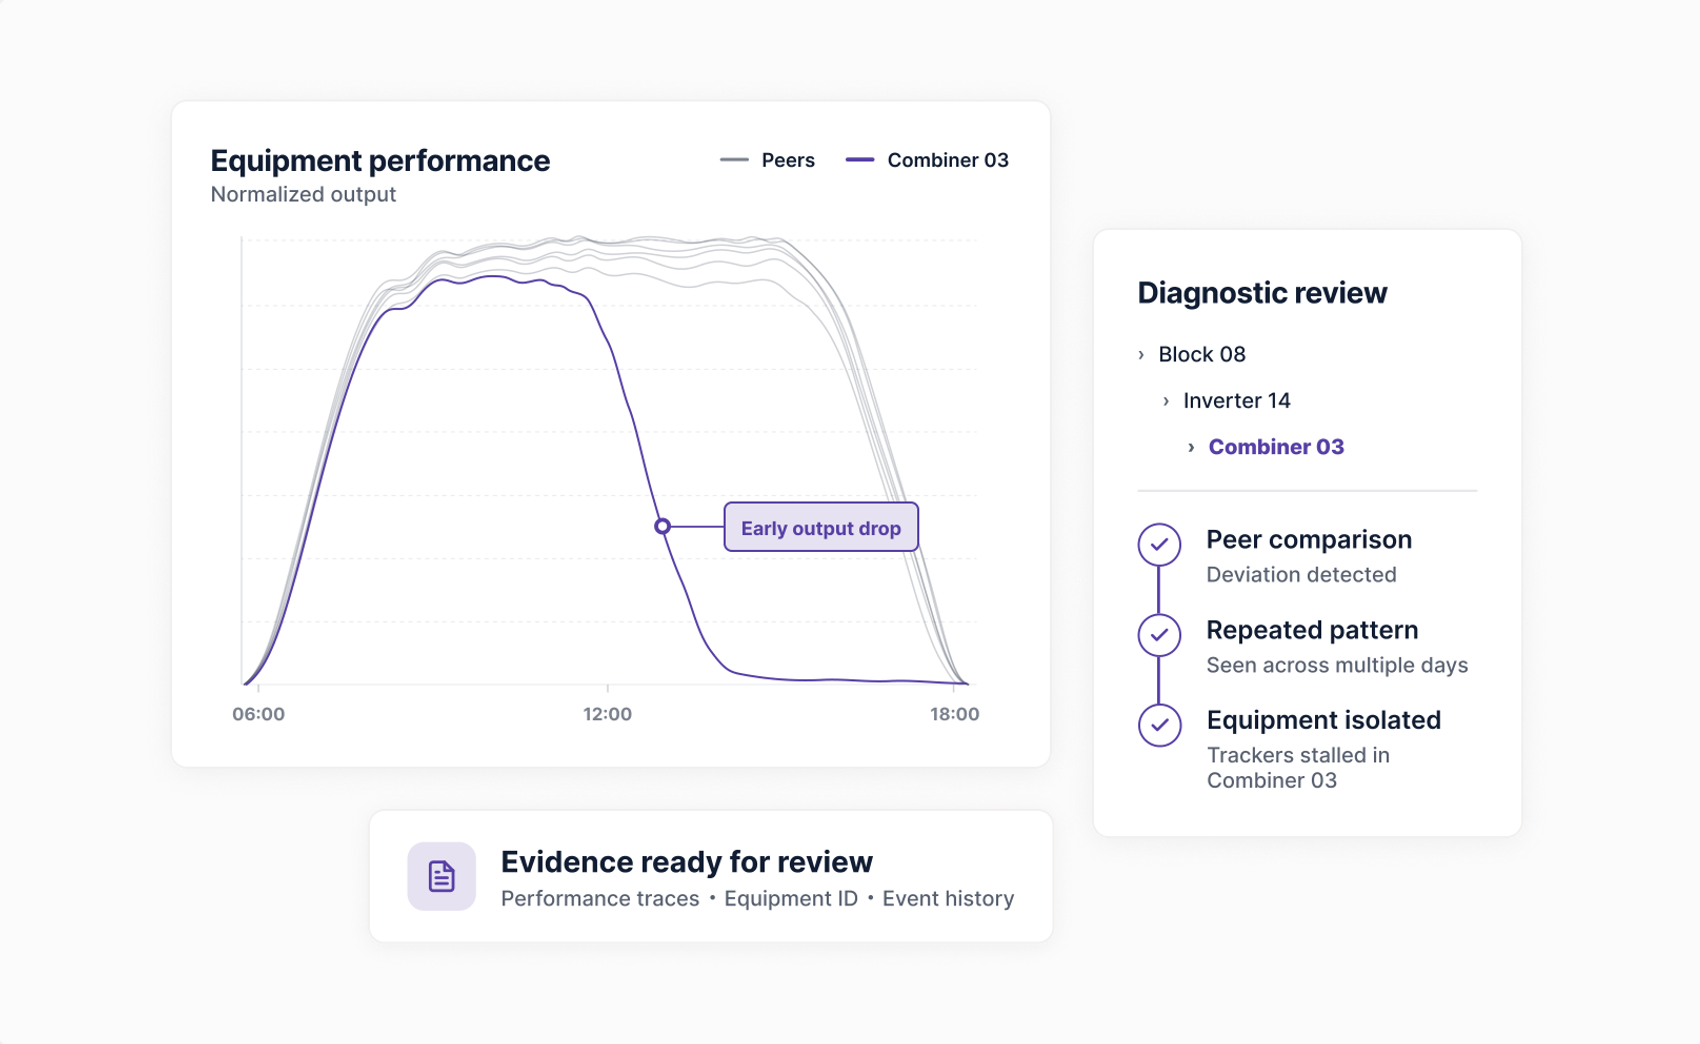
Attribute underperformance to specific equipment during commissioning, so repairs, reorders, and warranty claims are backed by data.
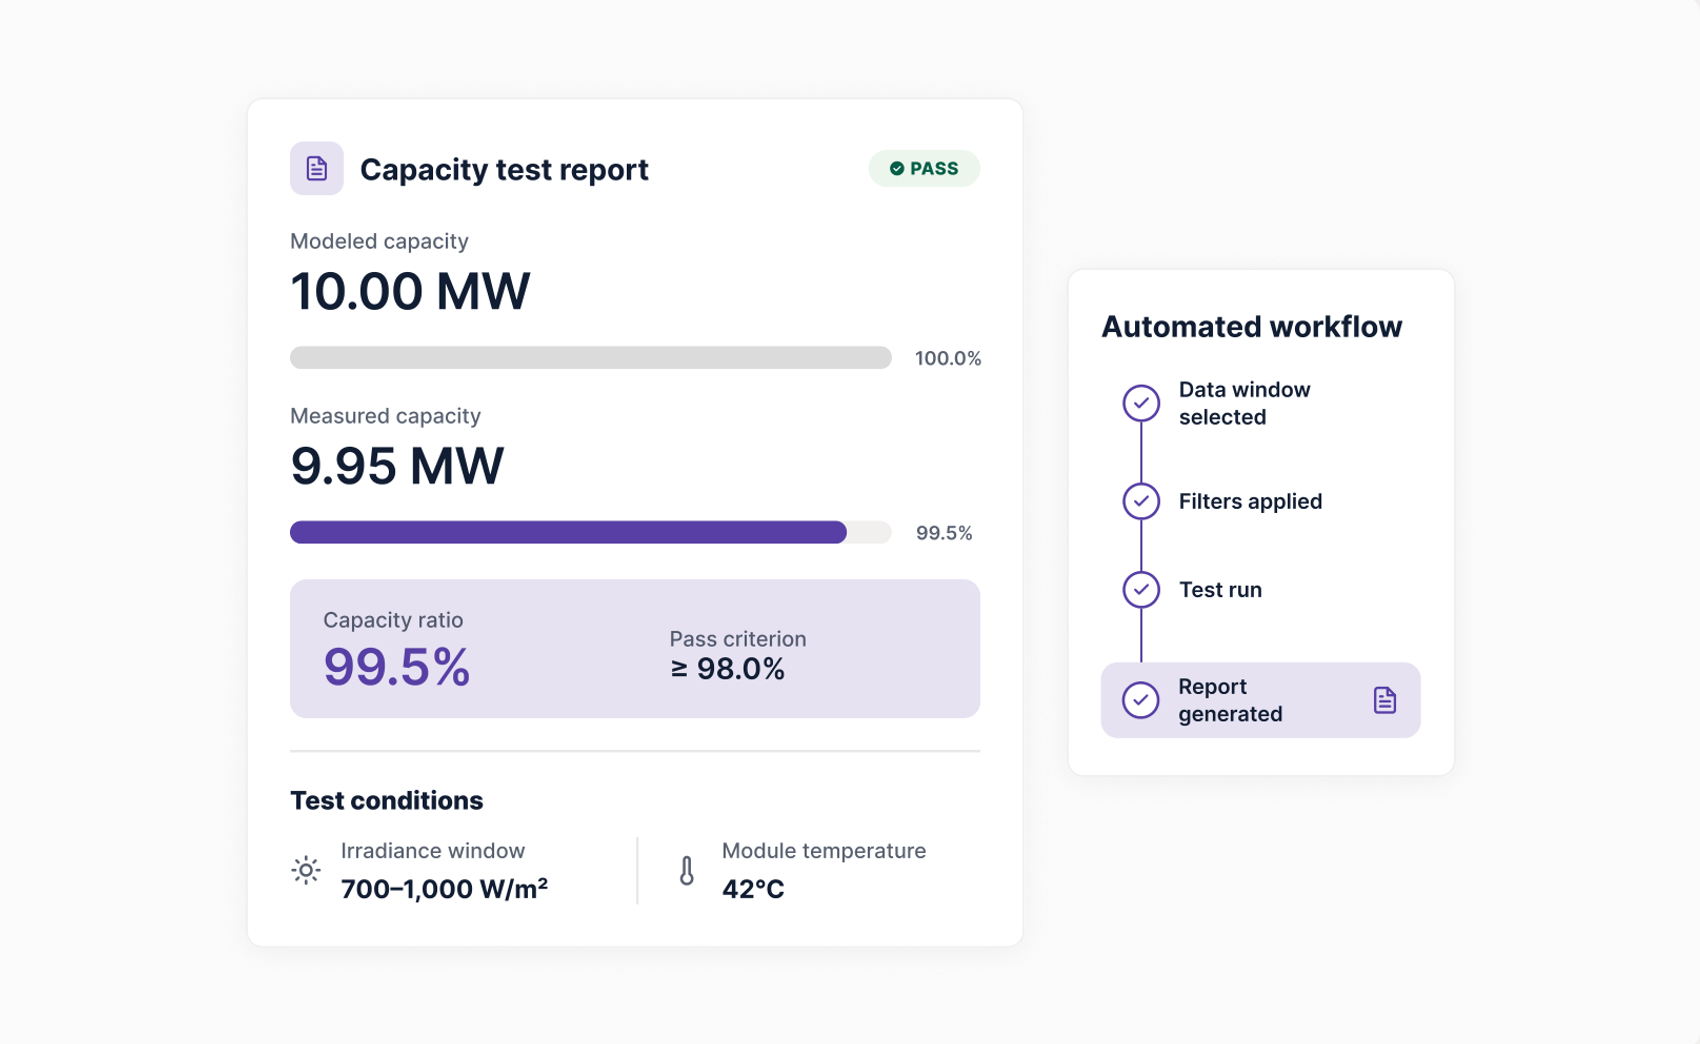
Run capacity tests against accurate modeled output with automated workflows, so results are defensible from day one.
3 sites. 60 days. Your best performer, your worst, and one in the middle. Every issue measured against budget and ranked by dollar impact.